Main wrapper function to compute and plot utility comparison between two lineup procedures.
Arguments
- data_proc_a
Dataframe for procedure A
- data_proc_b
Dataframe for procedure B
- base_rate_grid
Numeric vector of base rates (default: seq(0.01, 0.99, 0.01))
- utility_matrix
Named vector of utilities (default: c(tp=1, fn=-0.5, fp=-2, tn=0.5))
- utility_type
Character. "max", "avg", or "all" (default = "max")
- show_plot
Logical. Whether to display plot (default = TRUE)
- innocent_suspect
How innocent-suspect identifications in target-absent lineups are obtained.
"designated": the lineups had a designated innocent suspect, so target-absent"suspect"rows are counted directly, and zero such rows means a false-ID rate of zero."estimated": there was no designated innocent suspect, so the innocent-suspect count is estimated as filler IDs divided bylineup_size."auto"(the default) chooses"designated"when any target-absent row is a suspect ID or the data have a non-missingsuspect_poscolumn, and"estimated"otherwise, with a message.- ...
Additional arguments passed to plot_utility_difference()
Examples
# \donttest{
data(lineup_example)
odd <- seq(1, nrow(lineup_example), by = 2)
comparison <- compare_utility(lineup_example[odd, ],
lineup_example[-odd, ],
base_rate_grid = seq(0.1, 0.9, 0.1),
utility_type = "max")
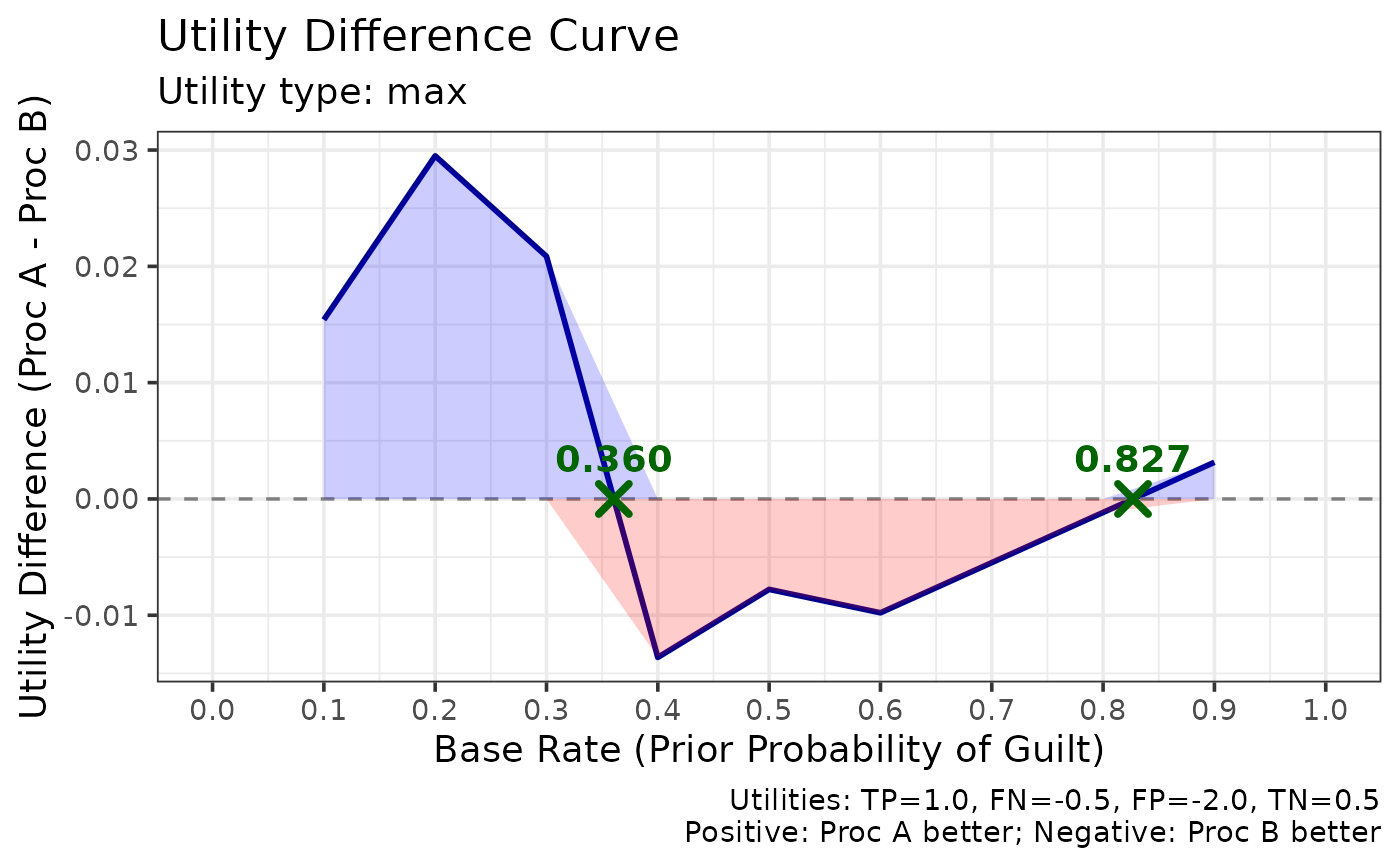 print(comparison)
#>
#> === Lineup Utility Comparison ===
#>
#> Utility type: max
#> Utility matrix:
#> tp fn fp tn
#> 1.0 -0.5 -2.0 0.5
#>
#> Crossover points (base rates where procedures are equivalent):
#> 0.360, 0.827
#>
#> Utility difference at key base rates:
#> (Positive = Proc A better; Negative = Proc B better)
#>
#> Base rate 0.1: +0.0154
#> Base rate 0.3: +0.0209
#> Base rate 0.5: -0.0078
#> Base rate 0.7: -0.0055
#> Base rate 0.9: +0.0032
#>
#> Plot: save this object first, then extract it with x$plot
# }