Bayesian Inference for Lineup Measures
Colin G. Tredoux
Tamsyn M. Naylor
2026-11-02
Source:vignettes/bayesian_inference.Rmd
bayesian_inference.RmdAcknowledgement. Large language models supplied by Anthropic and OpenAI were used in preparing this vignette, to assist with checking code, testing the veracity of the approaches described, and on occasion editing the text. Responsibility for the content rests with the authors.
Purpose
This vignette shows the Bayesian posterior summaries in r4lineups for lineup fairness and confidence-based eyewitness measures.
Use these functions when you want credible intervals or direct
probability statements such as
,
,
or
.
The examples use small posterior samples so that the vignette runs
quickly during package checks; increase S for final
analyses.
If you have only used frequentist methods
Most readers of this package will have been trained in the frequentist tradition, so this section sets out what is different here. Nothing in what follows requires accepting a philosophical position; it is mainly about what question the interval answers.
The question you probably want to ask. Having measured a six-person lineup and obtained an effective size of 4.8, a natural question is: what is the probability that this lineup’s effective size is below 4.5, a tolerance chosen before looking at the data? (Why not “below 6” is explained below: for effective size that question has the same answer, 1, whatever the data.) A frequentist confidence interval cannot answer that. It is a statement about the procedure — that intervals constructed this way contain the true value 95% of the time — not about this lineup. The true effective size either is or is not below 4.5, and frequentist probability does not attach to it.
A Bayesian credible interval does answer it. “There is a 95% probability that E′ lies between 4.1 and 5.6, given these data” is a statement about the quantity, and it is the statement most people believe they are making when they report a confidence interval.
How that is achieved. By treating the unknown quantity as having a distribution. Three steps:
- A prior describes what is believed before seeing
the data. Here the priors are deliberately weak —
alpha = 0.5is the Jeffreys prior for proportions, which is close to saying “no lineup member is favoured, and I am not confident about that either”. - The data update it through the likelihood.
- The result is the posterior, a full distribution for the quantity, from which any summary can be read: a median, an interval, or a direct probability such as .
Why the functions return draws rather than formulas.
Effective size is
— a nonlinear function of the choice probabilities. There is no tidy
closed form for its posterior. Instead the functions sample
S draws from the posterior of the probabilities and
transform each draw. The resulting collection of S values
is the posterior of E′, and any summary is computed from it.
This is why S is important: too few draws and the summaries
are noisy. Note that these are independent Monte Carlo draws, not MCMC.
Monte Carlo means summarising a distribution from random draws
taken from it. Markov chain Monte Carlo (MCMC) is the method
used when a posterior cannot be sampled directly: it builds a chain of
draws, each depending on the last, that only gradually settles into the
posterior, so its draws are correlated and the chain has to be checked
for convergence. Here the posteriors have standard forms and can be
sampled directly, so every draw is independent and there is no chain to
check (see Technical Details).
What you gain in practice, beyond the interpretation:
- Bounded quantities behave properly. E′ cannot exceed lineup size and a proportion cannot be negative. Normal-theory intervals can and do run outside those bounds at small samples; a posterior on the natural scale cannot.
- Direct probabilities. is often exactly what a report needs, and is awkward to extract from a p-value.
- Small samples degrade gracefully. With few mock witnesses the posterior becomes wide, which reflects the real uncertainty, rather than producing a narrow interval resting on an asymptotic approximation that does not hold.
What it does not give you. It is not a way of getting a decisive answer from thin data. A weak prior and a small sample give a wide posterior.
Data Shapes
The Bayesian fairness functions use mock-witness lineup choices:
- a lineup vector, where each value is the chosen lineup position; or
- a lineup table, where each cell is the count for one lineup position.
The Bayesian calibration function uses the standard confidence-based
data frame with target_present,
identification, and confidence. The SDT
comparison uses summary counts: hits, misses, false alarms, and correct
rejections for two conditions.
Effective Size
esize_T_bayes() fits a Dirichlet-multinomial model to
the lineup choice counts and transforms each posterior draw of the
choice-probability vector to Tredoux’s effective size
.
The Dirichlet distribution is a distribution over sets of probabilities that sum to 1, here the probabilities that a mock witness chooses each of the lineup members. It is the multi-category generalisation of the beta distribution, which describes a single probability. It has one parameter per member, , which acts like a count of choices imagined before seeing the data. With mock-witness counts , the posterior is again Dirichlet, with parameters : the prior counts are simply added to the observed ones. That is why the prior has little influence once there are a few dozen real choices, and why the posterior can be sampled exactly.
data(nortje2012)

lineup_vec <- nortje2012$lineup_1
k <- max(lineup_vec, na.rm = TRUE)
lineup_tab <- table(factor(lineup_vec, levels = seq_len(k)))

# An illustrative tolerance. In a real analysis choose and justify it in
# advance; the software cannot supply one.
tolerance <- 0.75 * k

set.seed(1)
esize_post <- esize_T_bayes(
  lineup_tab,
  alpha = 0.5,
  S = 1000,
  threshold = tolerance
)

esize_post
#> Bayesian Posterior: Effective Size E' (Tredoux, 1998)
#> ------------------------------------------------
#>   k (positions): 8    N (choices): 133    S (draws): 1000
#>   Prior: Dirichlet(alpha = 0.50)
#>   Posterior mean:   5.614
#>   Posterior median: 5.624
#>   95% credible interval: [4.804, 6.355]
#>   P(E' < 6.00 | data): 0.822
#>   P(E' > 6.00 | data): 0.178
plot(esize_post)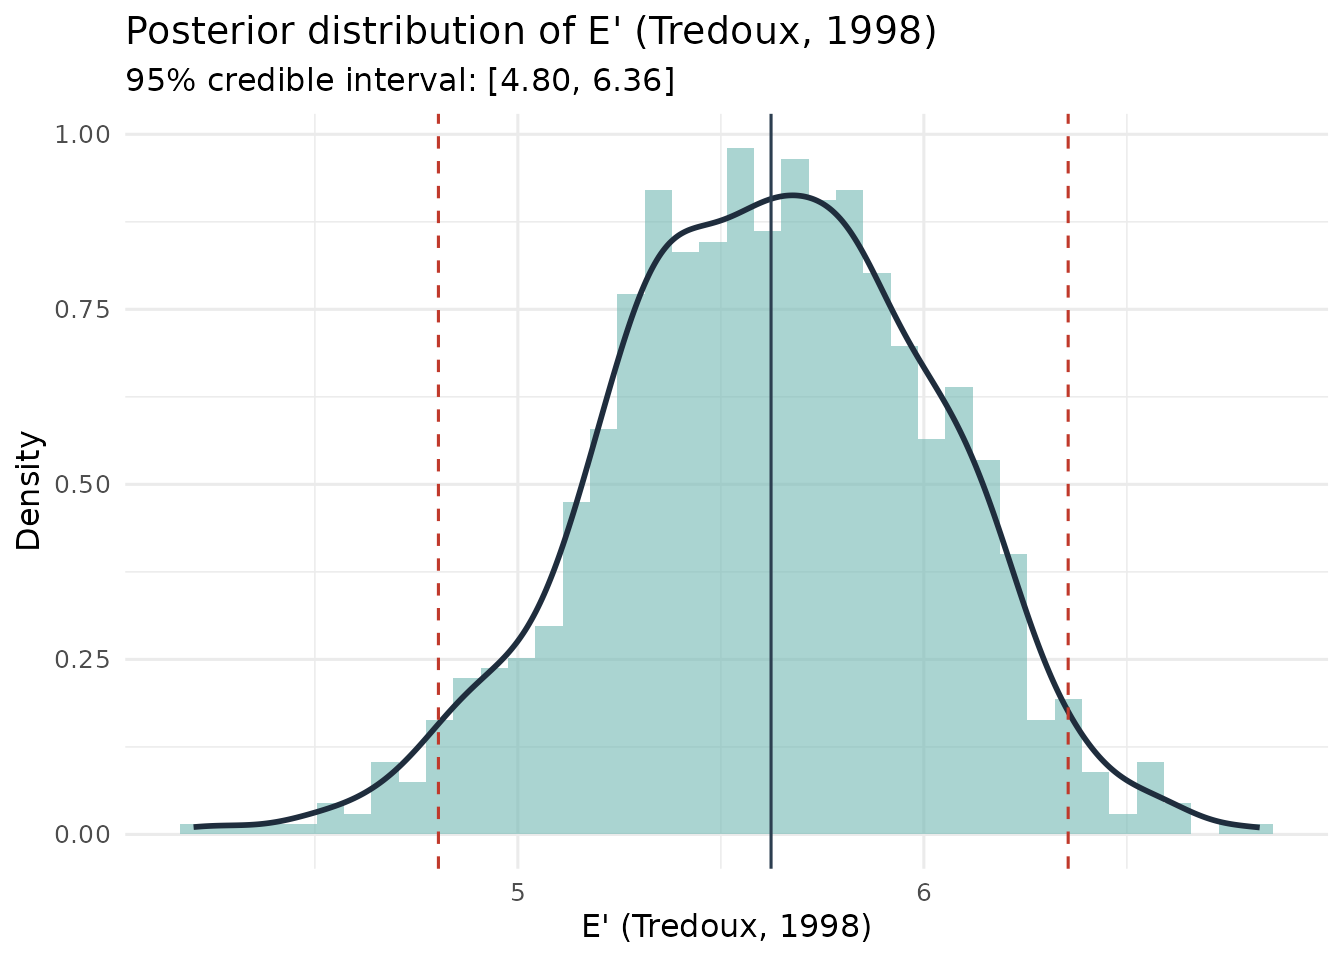
Why the threshold is not the nominal size. For any
choice probabilities over
members,
,
with equality only when all
probabilities are exactly equal. A continuous posterior gives that
single point probability zero, so
for any data at all, including perfectly balanced counts;
esize_T_bayes() warns if asked for it. Useful summaries are
the credible interval for
,
the interval for the deficit
,
or the probability below a tolerance chosen in advance:
deficit <- k - esize_post$E_draws
knitr::kable(
  data.frame(
    Summary  = c(sprintf("95%% interval for E' (k = %d)", k),
                 "95% interval for the deficit k - E'",
                 sprintf("P(E' < %.1f | data)", tolerance)),
    Value    = c(sprintf("[%.2f, %.2f]", esize_post$credible_interval[["lower"]],
                         esize_post$credible_interval[["upper"]]),
                 sprintf("[%.2f, %.2f]", quantile(deficit, .025),
                         quantile(deficit, .975)),
                 sprintf("%.3f", esize_post$threshold_probs$P_below))
  ),
  row.names = FALSE,
  caption = "Posterior summaries of effective size, nortje2012 lineup 1."
)| Summary | Value |
|---|---|
| 95% interval for E’ (k = 8) | [4.80, 6.36] |
| 95% interval for the deficit k - E’ | [1.64, 3.20] |
| P(E’ < 6.0 | data) | 0.822 |
Functional size does not have this problem: it is not bounded above by , so is informative.
Functional Size
func_size_bayes() models the suspect-selection rate with
a beta-binomial posterior and transforms posterior draws to functional
size.
set.seed(2)
func_post <- func_size_bayes(
  lineup_vec,
  target_pos = 3,
  alpha = 0.5,
  S = 1000,
  threshold = k
)

func_post
#> Bayesian Functional Size - Beta-Binomial model
#>   Prior: Jeffreys-type Beta(0.50, 0.50)
#>   n = 133, suspect IDs = 19 (rate = 0.143)
#>   Posterior mean F:   7.189
#>   Posterior median F: 6.904
#>   95% credible interval: [4.746, 10.898]
#>   P(F < 8.000 | data): 0.7480
#>   P(F > 8.000 | data): 0.2520
plot(func_post)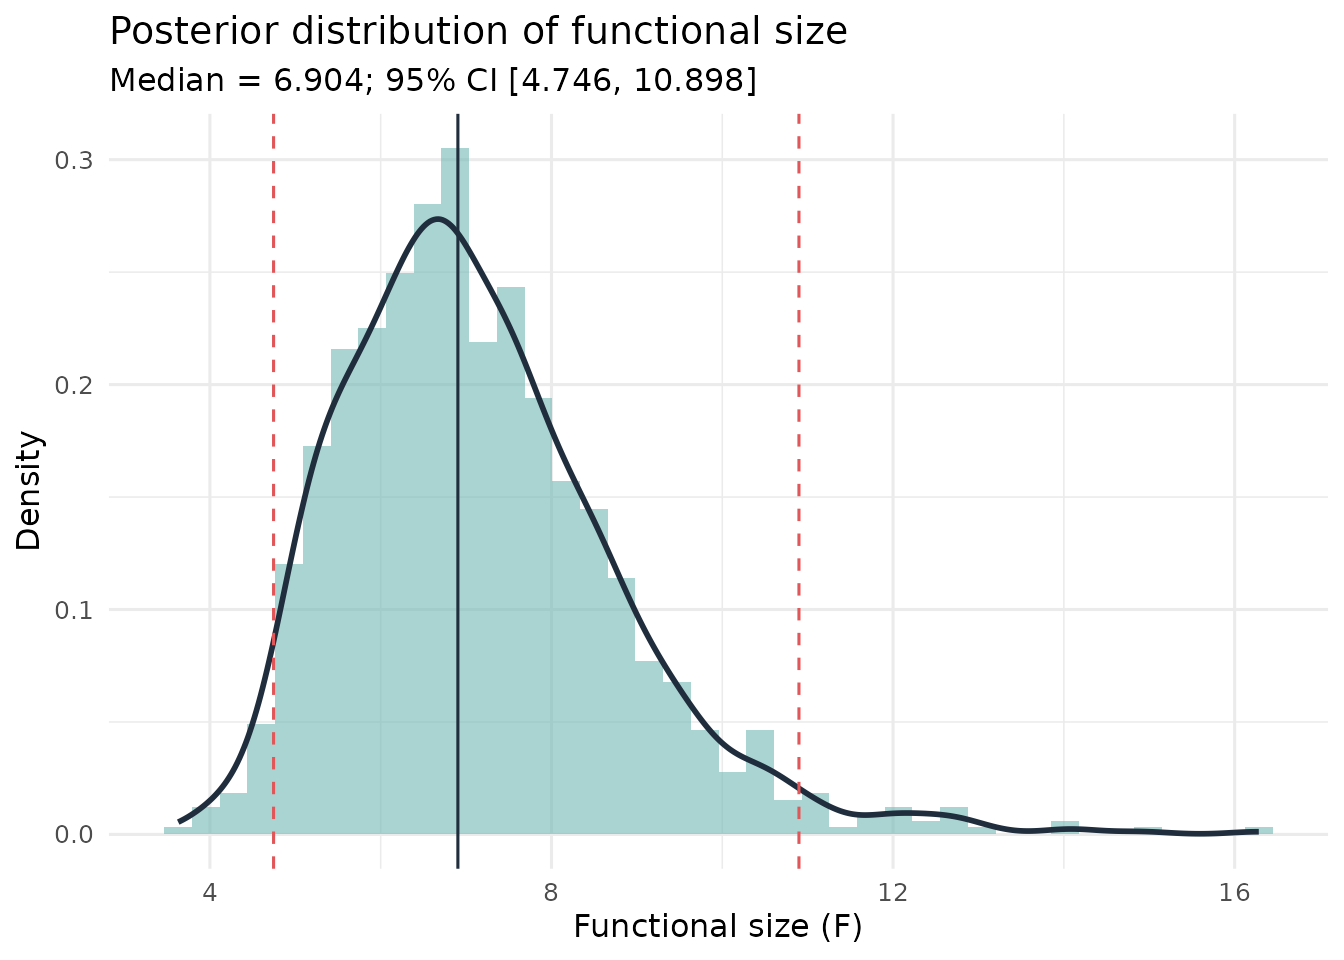
Diagnosticity Ratio
diag_ratio_T_bayes() models target-present and
target-absent suspect-selection rates with independent beta-binomial
posteriors and returns the posterior of the diagnosticity ratio.
tp_vec <- nortje2012$lineup_1
ta_vec <- nortje2012$lineup_2

set.seed(3)
diag_post <- diag_ratio_T_bayes(
  lineup_pres = tp_vec,
  lineup_abs = ta_vec,
  pos_pres = 3,
  pos_abs = 3,
  k1 = max(tp_vec, na.rm = TRUE),
  k2 = max(ta_vec, na.rm = TRUE),
  alpha = 0.5,
  S = 1000,
  threshold = 1
)

diag_post
#> Bayesian Diagnosticity Ratio (Tredoux) - Beta-Binomial model
#>   Prior: Jeffreys-type Beta(0.50, 0.50)
#>   TP lineup: n = 133, suspect IDs = 19
#>   TA lineup: n = 133, suspect IDs = 5
#>   Posterior mean DR:   4.301
#>   Posterior median DR: 3.645
#>   95% credible interval: [1.550, 11.214]
#>   P(DR < 1.000 | data): 0.0010
#>   P(DR > 1.000 | data): 0.9990
plot(diag_post)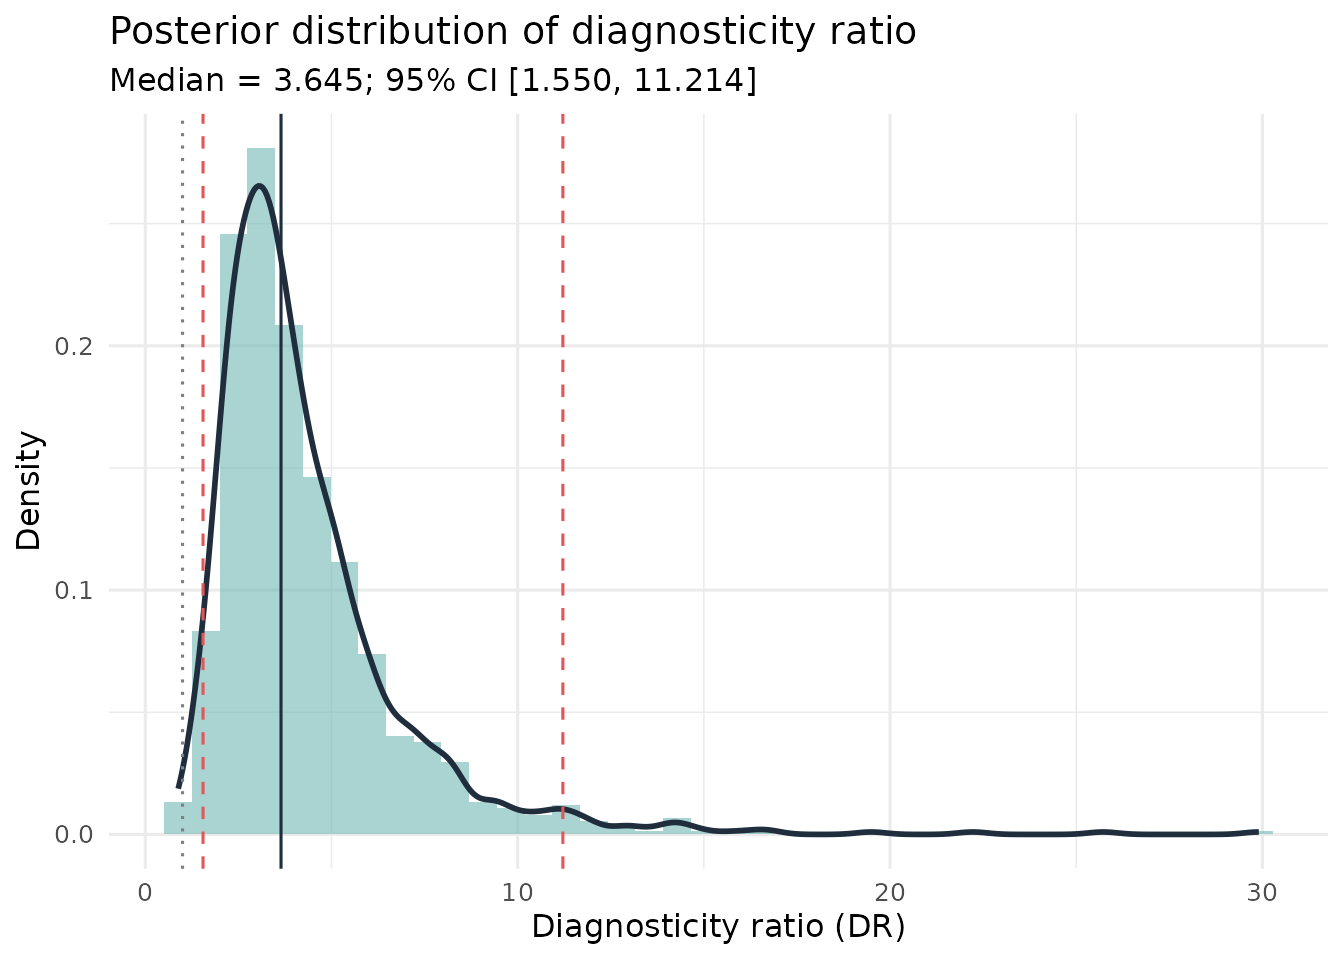
The threshold 1 is useful because
indicates that suspect identifications are more common in the
target-present lineup than in the target-absent lineup.
Calibration
The Bayesian calibration model conditions on bin frequencies and
treats correctness within each bin as exchangeable Bernoulli
observations. Fixed target-present and target-absent trial totals do not
generally imply that conditional binomial likelihood. Interpret these
intervals as working-model summaries for that assumption, rather than
automatically exact inference for a fixed-arm experiment. Filler-derived
fractional counts add another approximation; see
?calibration_bayes.
calibration_bayes() places beta posteriors on accuracy
within confidence bins and propagates uncertainty into calibration
,
over/underconfidence
,
and normalized resolution
.
data(lineup_example)

set.seed(4)
cal_post <- calibration_bayes(
  lineup_example,
  confidence_bins = c(0, 60, 80, 100),
  alpha = 0.5,
  S = 1000
)

cal_post
#> Bayesian Calibration Analysis - Beta-Binomial model
#>   n = 503; 3 confidence bins; prior alpha = 0.50
#>   C (calibration):      mean = 0.0729, median = 0.0727, 95% CI [0.0545, 0.0913]
#>   O/U (over/underconf): mean = -0.2268, median = -0.2266, 95% CI [-0.2564, -0.1931]
#>   NRI (resolution):     mean = 0.0450, median = 0.0447, 95% CI [0.0216, 0.0721]
#>   (Frequentist: C = 0.0727, O/U = -0.2290, NRI = 0.0453)
plot(cal_post, metric = "C")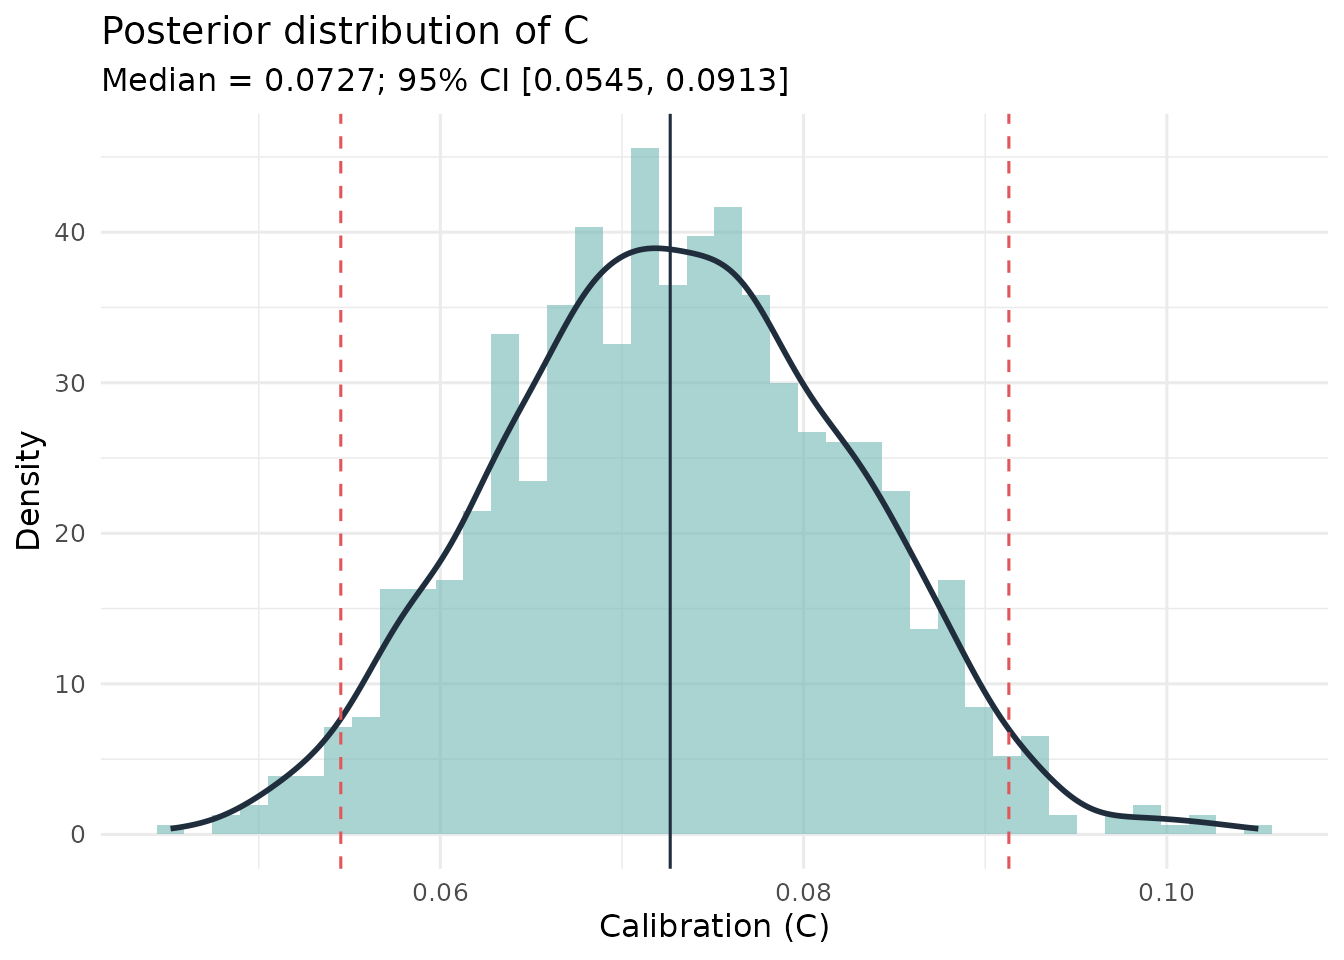
plot(cal_post, metric = "NRI")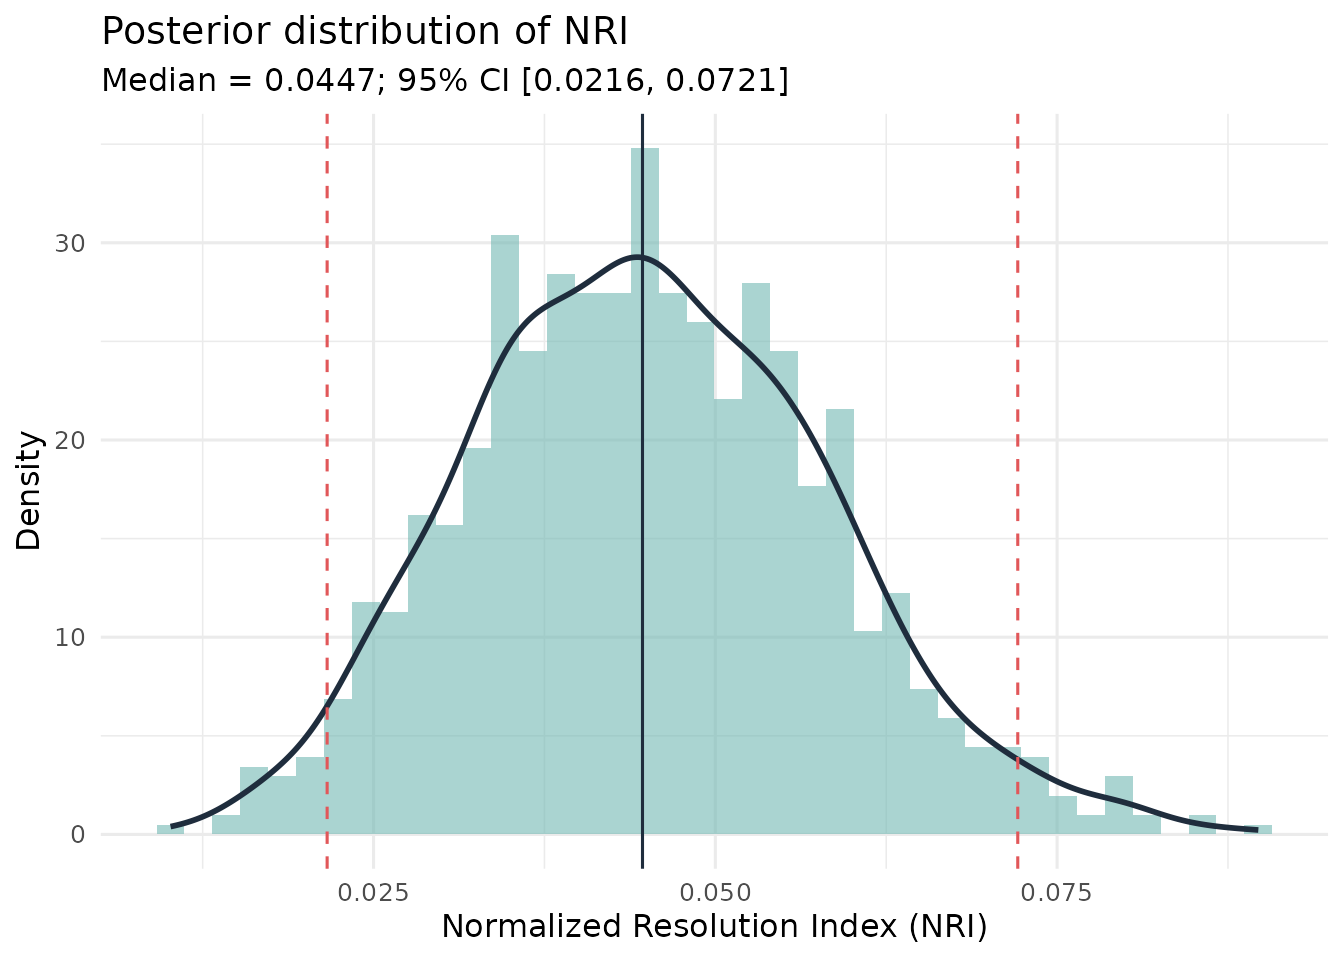
SDT d’ Comparison
sdt_compare() compares two conditions using summary SDT
counts. It draws from posterior hit and false-alarm rates, converts each
draw to
,
and reports the posterior for
.
set.seed(5)
sdt_post <- sdt_compare(
  hits_A = 45, misses_A = 55, fas_A = 12, crs_A = 88,
  hits_B = 38, misses_B = 62, fas_B = 10, crs_B = 90,
  label_A = "Procedure A",
  label_B = "Procedure B",
  alpha = 0.5,
  S = 1000
)

sdt_post
#> Bayesian SDT Comparison: Procedure A vs Procedure B
#>   Prior: Jeffreys Beta(0.50, 0.50) on HR and FAR
#>   Posterior mean d': Procedure A = 1.042, Procedure B = 0.971
#>   Delta d' (Procedure A - Procedure B):
#>     Posterior mean:   0.072
#>     Posterior median: 0.072
#>     95% CI: [-0.505, 0.635]
#>   P(d'_Procedure A > d'_Procedure B | data): 0.6150
#>   P(d'_Procedure B > d'_Procedure A | data): 0.3850
#>   (Frequentist z-test: z = 0.254, p = 0.7994)
plot(sdt_post)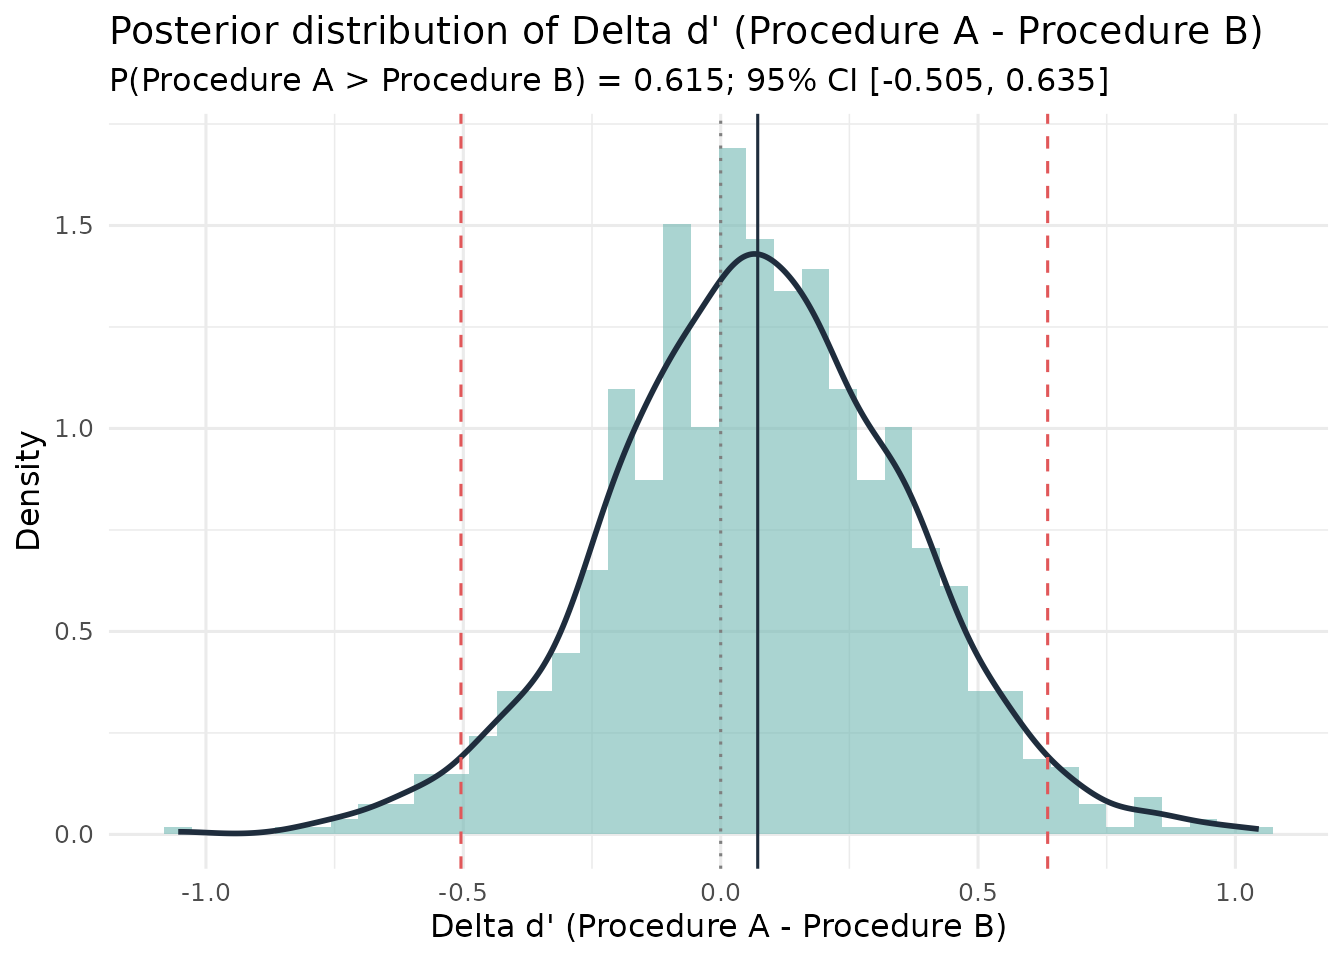
Workflow Position
These Bayesian functions complement, rather than replace, the frequentist and bootstrap functions elsewhere in the package:
- use normal-theory functions for quick classical intervals where assumptions are acceptable;
- use bootstrap functions when you want sampling-distribution uncertainty with minimal distributional assumptions;
- use Bayesian functions when credible intervals and direct posterior probabilities are the clearest way to express uncertainty.
For substantive reports, run enough posterior draws for stable
summaries and check sensitivity to the prior concentration, for example
alpha = 0.1, 0.5, and 1.
sensitivity <- do.call(rbind, lapply(c(0.1, 0.5, 1.0), function(a) {
  set.seed(11)
  post <- esize_T_bayes(lineup_tab, alpha = a, S = 2000)
  data.frame(
    `Prior alpha`      = a,
    `Posterior median` = round(post$posterior_median, 3),
    `Lower`            = round(post$credible_interval[["lower"]], 3),
    `Upper`            = round(post$credible_interval[["upper"]], 3),
    check.names = FALSE
  )
}))

knitr::kable(
  sensitivity, row.names = FALSE,
  caption = "Sensitivity of the E' posterior to prior concentration, nortje2012 lineup 1 (nominal size 8)."
)| Prior alpha | Posterior median | Lower | Upper |
|---|---|---|---|
| 0.1 | 5.530 | 4.702 | 6.255 |
| 0.5 | 5.622 | 4.785 | 6.346 |
| 1.0 | 5.706 | 4.861 | 6.485 |
If the three rows agree closely, as they generally will once there are a few dozen choices, the prior is doing little and the result is driven by the data. Disagreement is a signal that the sample is too small for the data to dominate, and should be reported rather than resolved by picking a prior.
Technical Details
What is being sampled
One definition of E′. Tredoux (1998) defined
effective size through an index of diversity,
,
transformed back to a count of members:
.
Substituting
gives
,
the reciprocal of Simpson’s concentration index, also known as the
inverse Simpson or inverse Herfindahl index. The two forms are
algebraically identical; they differ only in notation, and this package
uses
throughout. What differs between functions is the input.
esize_T() substitutes the observed proportions
;
esize_T_bayes() applies the same formula to each posterior
draw of the true probabilities. The posterior median therefore need not
equal the classical point estimate, particularly in small samples, and
that gap reflects estimation, not a different definition. The
bias-corrected estimate from esize_T(..., unbiased = TRUE)
is a third estimator of the same quantity.
| Function | Model | Transformation applied to each draw |
|---|---|---|
esize_T_bayes() |
Dirichlet-multinomial on the k choice counts | |
func_size_bayes() |
Beta-binomial on suspect selections | |
diag_ratio_T_bayes() |
Independent beta-binomials for the two lineups | |
calibration_bayes() |
Beta posterior on accuracy within each confidence bin | C, O/U and NRI |
sdt_compare() |
Beta posteriors on hit and false-alarm rates |
In each case the posterior of the transformed quantity is obtained by transforming draws, not by approximating the transformation. This is important for quantities like , a ratio whose sampling distribution is markedly skewed: the posterior inherits that skew correctly, where a symmetric normal-theory interval would not.
The prior
alpha is the concentration parameter of the Dirichlet or
beta prior, applied symmetrically. alpha = 0.5 is the
Jeffreys prior, alpha = 1 is uniform, and smaller values
place more weight near the boundaries. All are weak; with more than a
few dozen observations the likelihood dominates, which the sensitivity
check above is there to confirm.
Monte Carlo error
The posteriors here are conjugate: a Dirichlet prior
with multinomial counts gives a Dirichlet posterior, and a beta prior
with binomial counts gives a beta posterior. Both are standard
distributions with known forms, so the functions draw from the exact
posterior directly (Dirichlet draws by normalising independent gamma
draws, beta draws with rbeta()). Each draw is independent
of the others.
MCMC is needed only when a posterior cannot be sampled like this, typically because its normalising constant cannot be computed. A Markov chain is then constructed whose long-run distribution is the posterior; successive draws are correlated, early draws must be discarded as burn-in, and convergence has to be checked (for example with R-hat and the effective sample size). None of that applies here. , and the other summaries are fixed transformations of each draw, so the transformed values are also independent draws from their exact posteriors, even though those posteriors have no closed form.
The practical consequences are that there is no burn-in, thinning or
convergence diagnostic; the effective sample size is simply
S; and Monte Carlo error falls as
.
The Monte Carlo standard error of a tail probability
,
for example, is about
:
0.016 for
at S = 1000, and 0.005 at S = 10000.
S = 1000 is adequate for a median, but tail probabilities
and interval endpoints need more; use 10,000 or more where a reported
number depends on them. This simplicity rests on conjugacy:
non-conjugate priors or hierarchical extensions would bring MCMC
back.
Assumptions
- Choices are independent across witnesses, and each witness contributes one.
- The Dirichlet-multinomial prior is symmetric: every member receives
the same prior count
alpha, so before any choices are seen no member is expected to draw more choices than another. That is a statement of prior ignorance, not a claim that the foils are equally good in fact. The prior counts are added to the observed choices, so with even a moderate number of mock witnesses the observed differences between members dominate, and the posterior can show that a lineup is very unequal. The symmetric prior does pull small samples slightly towards equal probabilities, and so towards a larger E′, which is one reason to report the sensitivity check above. -
diag_ratio_T_bayes()treats the two lineups as independent samples. -
sdt_compare()assumes equal-variance signal detection, as the classical does.
References
Tredoux, C. G. (1998). Statistical inference on measures of lineup fairness. Law and Human Behavior, 22(2), 217-237.
Further Reading
-
?esize_T_bayes,?func_size_bayes,?diag_ratio_T_bayes,?calibration_bayes,?sdt_compare - The main vignette for the frequentist and bootstrap counterparts, and for the small-sample bias of the plug-in E′ estimator