Main function to compute and plot CAC (Confidence-Accuracy Characteristic) for eyewitness lineup data.
Usage
make_cac(
  data,
  lineup_size = 6,
  confidence_bins = NULL,
  show_plot = TRUE,
  innocent_suspect = "auto",
  base_rate = NULL,
  ...
)
Arguments
- data
A dataframe with columns: target_present, identification, confidence
- lineup_size
Integer. Number of people in lineup (default = 6)
- confidence_bins
Numeric vector of bin edges (optional)
- show_plot
Logical. Whether to display the plot (default = TRUE)
- innocent_suspect
How innocent-suspect identifications in target-absent lineups are obtained.
"designated": the lineups had a designated innocent suspect, so target-absent"suspect"rows are counted directly, and zero such rows means a false-ID rate of zero."estimated": there was no designated innocent suspect, so the innocent-suspect count is estimated as filler IDs divided bylineup_size."auto"(the default) chooses"designated"when any target-absent row is a suspect ID or the data have a non-missingsuspect_poscolumn, and"estimated"otherwise, with a message.- base_rate
See
make_cacdata.- ...
Additional arguments passed to make_cac_gg()
Examples
data(lineup_example)
cac_result <- make_cac(lineup_example, confidence_bins = c(0, 60, 80, 100))
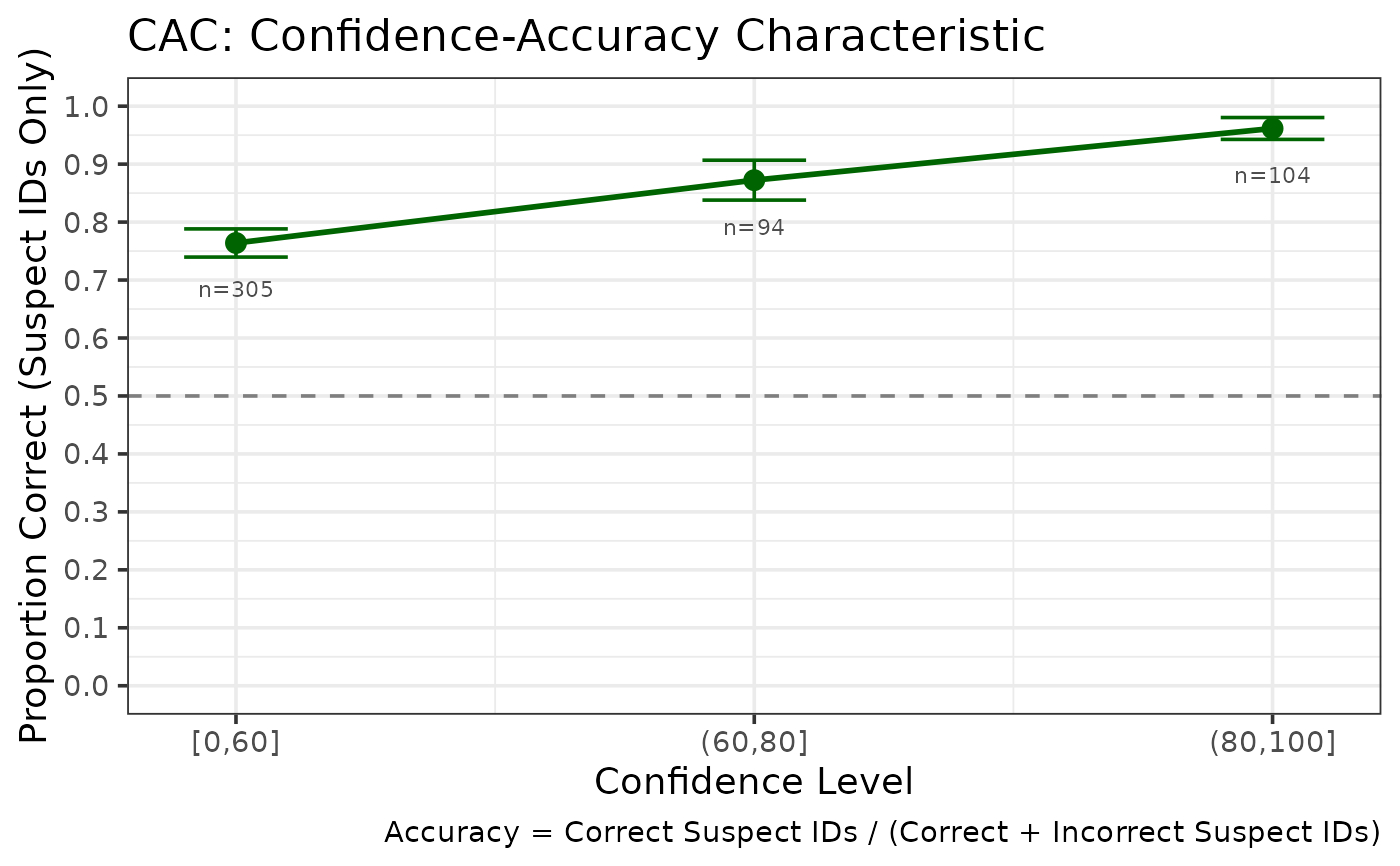 print(cac_result)
#>
#> === Lineup CAC Analysis ===
#>
#> Overall Accuracy: 0.825
#> Total Suspect IDs: 503
#> Lineup size: 6
#>
#> CAC Data:
#> # A tibble: 3 × 6
#> confidence n_correct n_incorrect n_total accuracy se
#> <chr> <int> <int> <int> <dbl> <dbl>
#> 1 [0,60] 233 72 305 0.764 0.0243
#> 2 (60,80] 82 12 94 0.872 0.0344
#> 3 (80,100] 100 4 104 0.962 0.0189
#>
#> Plot: use plot(x), or save the object and extract x$plot