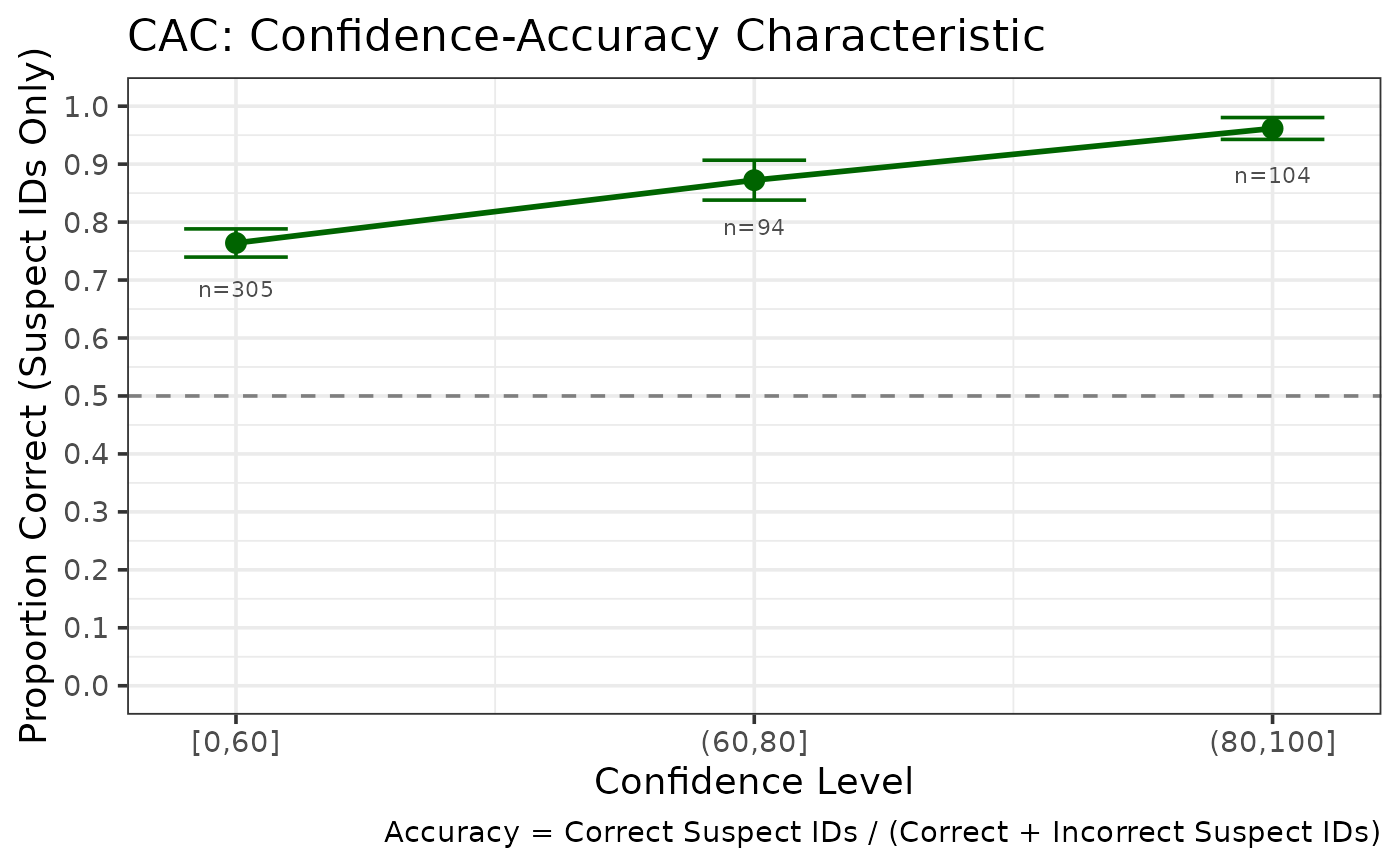
Creates a ggplot2 visualization of CAC data showing the relationship between confidence and accuracy.
Examples
data(lineup_example)
cac <- make_cacdata(lineup_example, confidence_bins = c(0, 60, 80, 100))
make_cac_gg(cac)
Creates a ggplot2 visualization of CAC data showing the relationship between confidence and accuracy.
data(lineup_example)
cac <- make_cacdata(lineup_example, confidence_bins = c(0, 60, 80, 100))
make_cac_gg(cac)