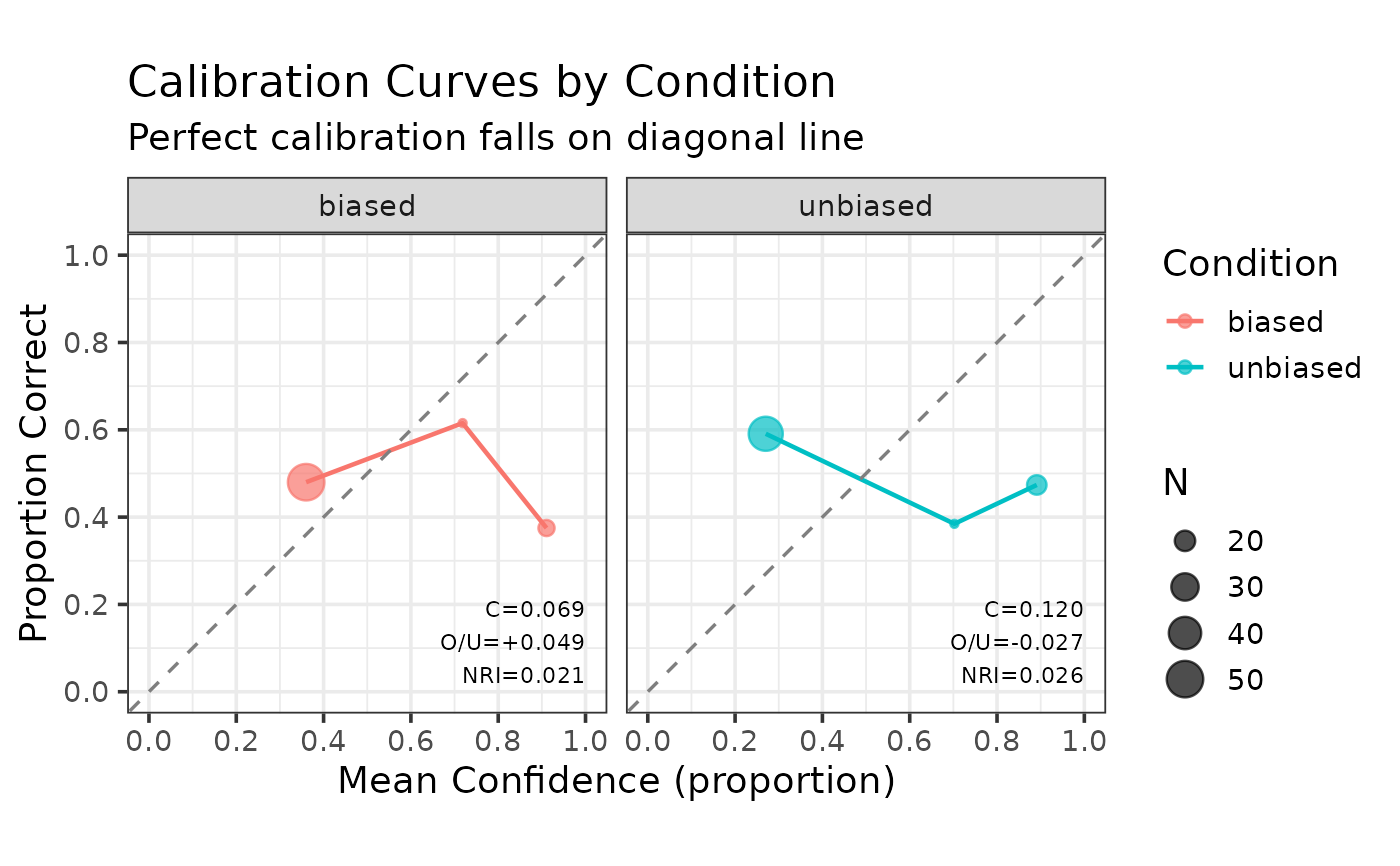
Plot Calibration Curves by Condition
Source:R/calibration_functions.R
make_calibration_by_condition_gg.RdCreates a faceted or overlaid plot comparing calibration across conditions.
Examples
set.seed(123)
n <- 300
data <- data.frame(
  target_present = rep(c(TRUE, FALSE), each = n / 2),
  identification = sample(c("suspect", "filler", "reject"), n,
                          replace = TRUE, prob = c(0.5, 0.25, 0.25)),
  confidence = round(runif(n, 0, 100)),
  instruction = rep(c("biased", "unbiased"), times = n / 2)
)
by_cond <- make_calibration_by_condition(data, condition_vars = "instruction",
                                         confidence_bins = c(0, 60, 80, 100))
make_calibration_by_condition_gg(by_cond)