Convenience wrapper that computes PPV range and creates visualizations.
Usage
make_ppv_range(
  data,
  lineup_size = 6,
  confidence_bins = NULL,
  show_plots = TRUE,
  plot_type = "all",
  innocent_suspect = "auto",
  base_rate = NULL
)
Arguments
- data
A dataframe with columns: target_present, identification, confidence
- lineup_size
Integer. Nominal number of people in lineup (default = 6)
- confidence_bins
Numeric vector of bin edges (optional)
- show_plots
Logical. Whether to create plots (default = TRUE)
- plot_type
Character. Which plots to create: "ppv" (PPV range only), "effective" (effective size only), "all" (all plots, default)
- innocent_suspect
How innocent-suspect identifications in target-absent lineups are obtained.
"designated": the lineups had a designated innocent suspect, so target-absent"suspect"rows are counted directly, and zero such rows means a false-ID rate of zero."estimated": there was no designated innocent suspect, so the innocent-suspect count is estimated as filler IDs divided bylineup_size."auto"(the default) chooses"designated"when any target-absent row is a suspect ID or the data have a non-missingsuspect_poscolumn, and"estimated"otherwise, with a message.- base_rate
Prior probability that the suspect is guilty.
NULL(default) computes PPV from counts, as below. A number strictly between 0 and 1 computes it from the guilty-ID rate (per target-present trial) and the innocent-suspect-ID rate (per target-absent trial) at that prior, so the result does not depend on the TP:TA split.
Value
A list of class "lineup_ppv_range" containing:
ppv_range_data: Dataframe with all PPV estimates
plot_ppv_range: ggplot of PPV range (if requested)
plot_effective_size: ggplot of effective size (if requested)
plot_error_rate: ggplot of error rates (if requested)
... (additional components from ppv_range_by_confidence)
Examples
data(lineup_example)
# With confidence binning
result <- make_ppv_range(lineup_example, confidence_bins = c(0, 60, 80, 100))
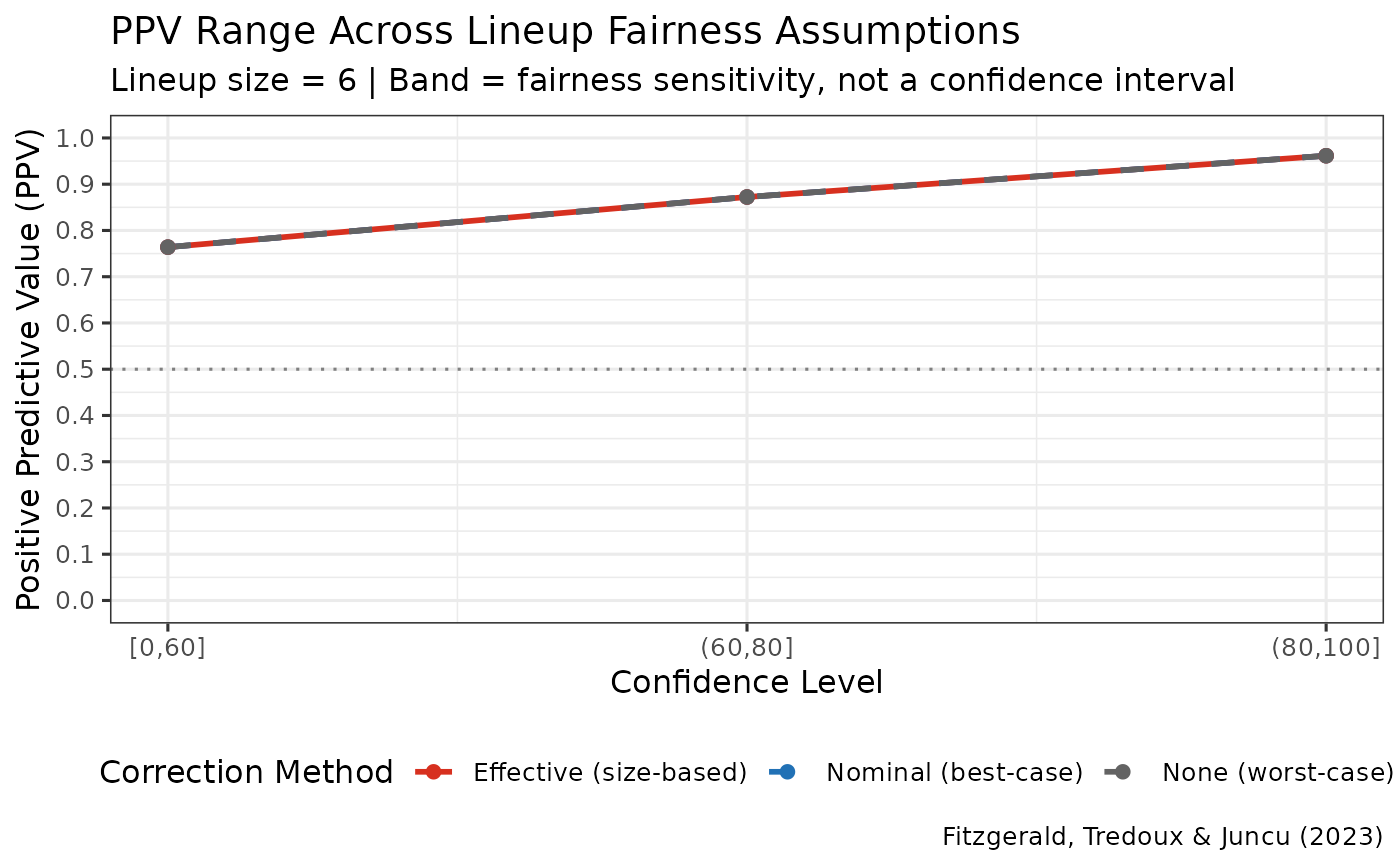
#> Target-absent lineups contain a designated innocent suspect, so innocent-suspect IDs are counted directly and no lineup-size correction is applied. The nominal, effective and uncorrected estimates are therefore identical for these data. The three diverge only when no innocent suspect is designated and the number of innocent-suspect IDs has to be estimated from the filler IDs.
# Access plots
result$plot_ppv_range
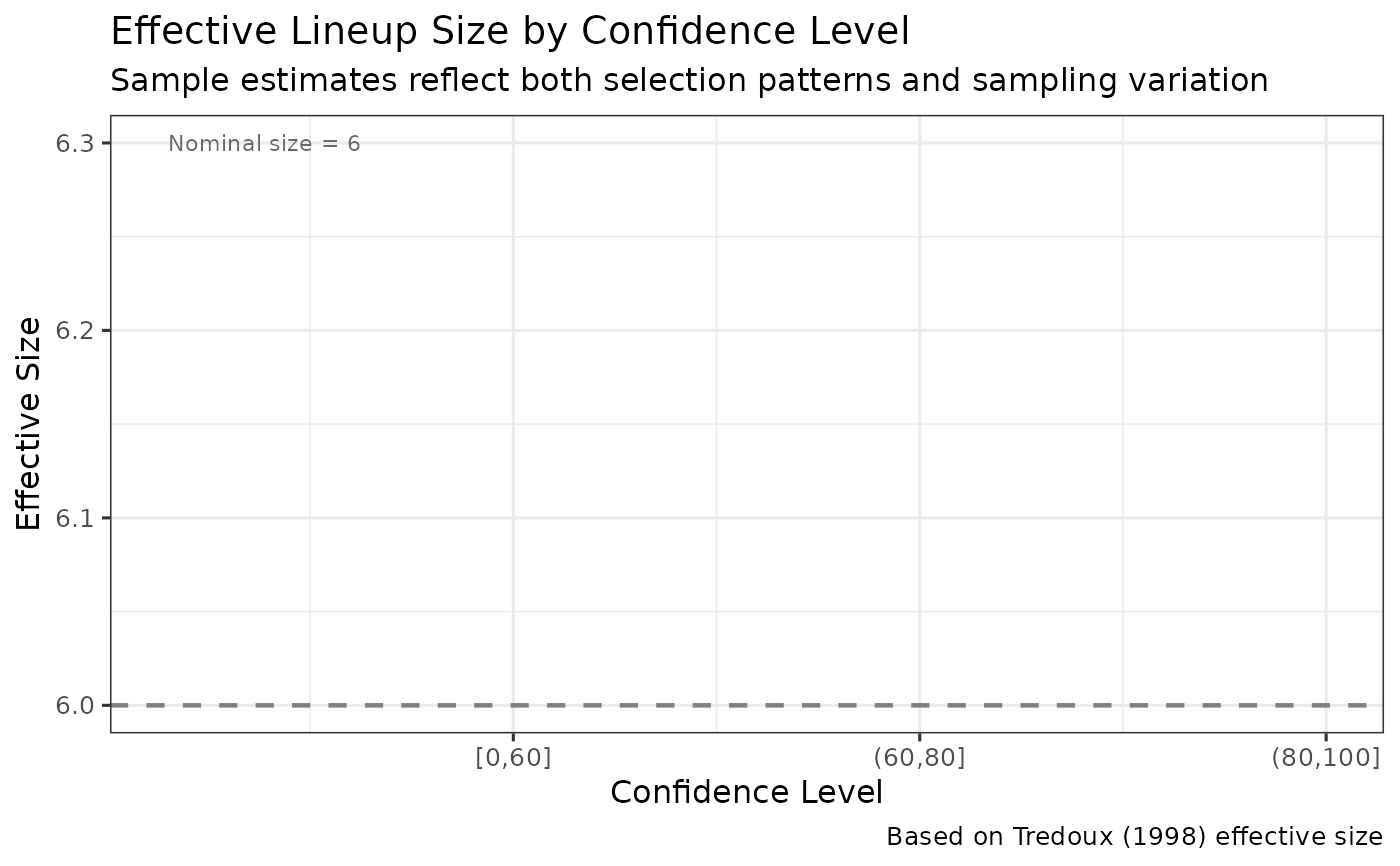
 result$plot_effective_size
#> Warning: Removed 3 rows containing missing values or values outside the scale range
#> (`geom_line()`).
#> Warning: Removed 3 rows containing missing values or values outside the scale range
#> (`geom_point()`).