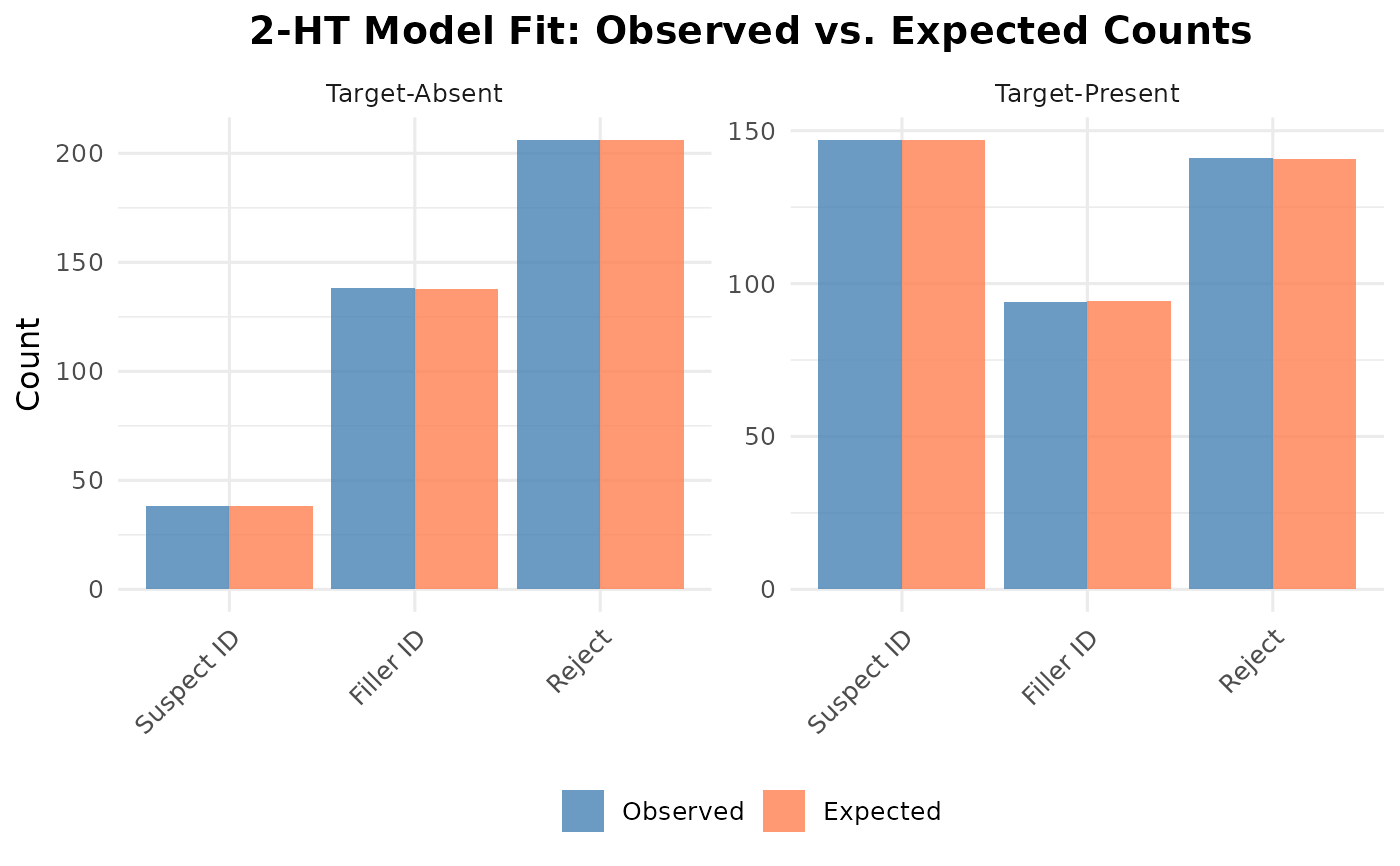
Creates a comparison plot showing observed counts vs. model-predicted expected counts for both target-present and target-absent lineups.
Examples
counts <- c(
  n_tp_suspect = 147, n_tp_filler = 94, n_tp_reject = 141,
  n_ta_suspect = 38, n_ta_filler = 138, n_ta_reject = 206
)
fit <- fit_winter_2ht(counts, lineup_size = 6)
#> Warning: 2-HT estimate is on a parameter boundary; regular Hessian standard errors are unavailable. Bootstrap intervals also need boundary qualification.
plot_2ht_fit(fit)