Plot Bootstrap Distribution of ANRI Difference
Source:R/anri_functions.R
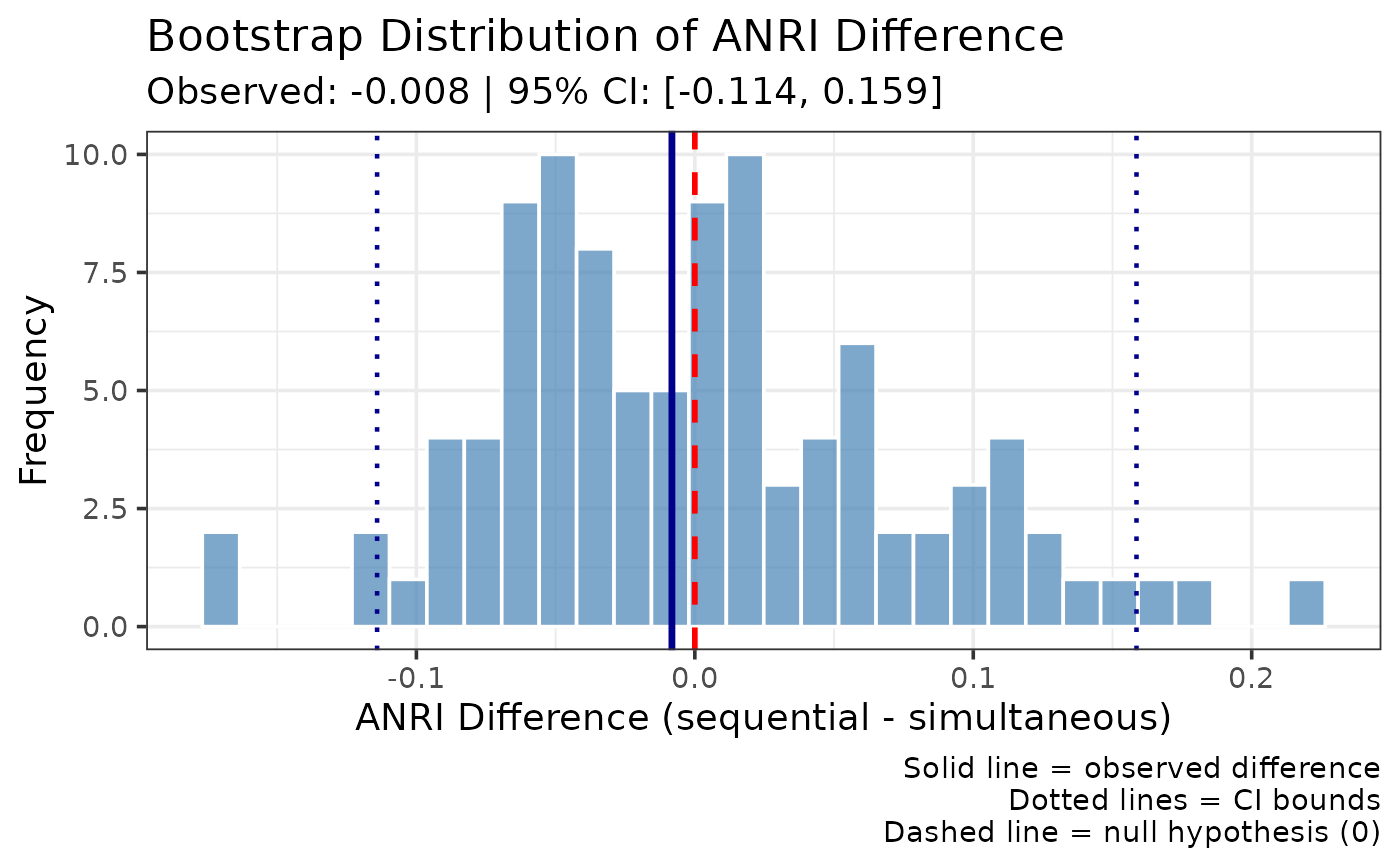
plot_anri_difference_distribution.RdCreates a histogram of the bootstrap distribution of the difference between two groups.
Examples
# \donttest{
set.seed(123)
n <- 300
data <- data.frame(
target_present = rep(c(TRUE, FALSE), each = n / 2),
identification = sample(c("suspect", "filler", "reject"), n,
replace = TRUE, prob = c(0.5, 0.25, 0.25)),
confidence = round(runif(n, 0, 100)),
condition = rep(c("sequential", "simultaneous"), times = n / 2)
)
cmp <- compare_anri(data, group_var = "condition",
confidence_bins = seq(0, 100, 20),
n_bootstrap = 100, seed = 1)
plot_anri_difference_distribution(cmp)
 # }