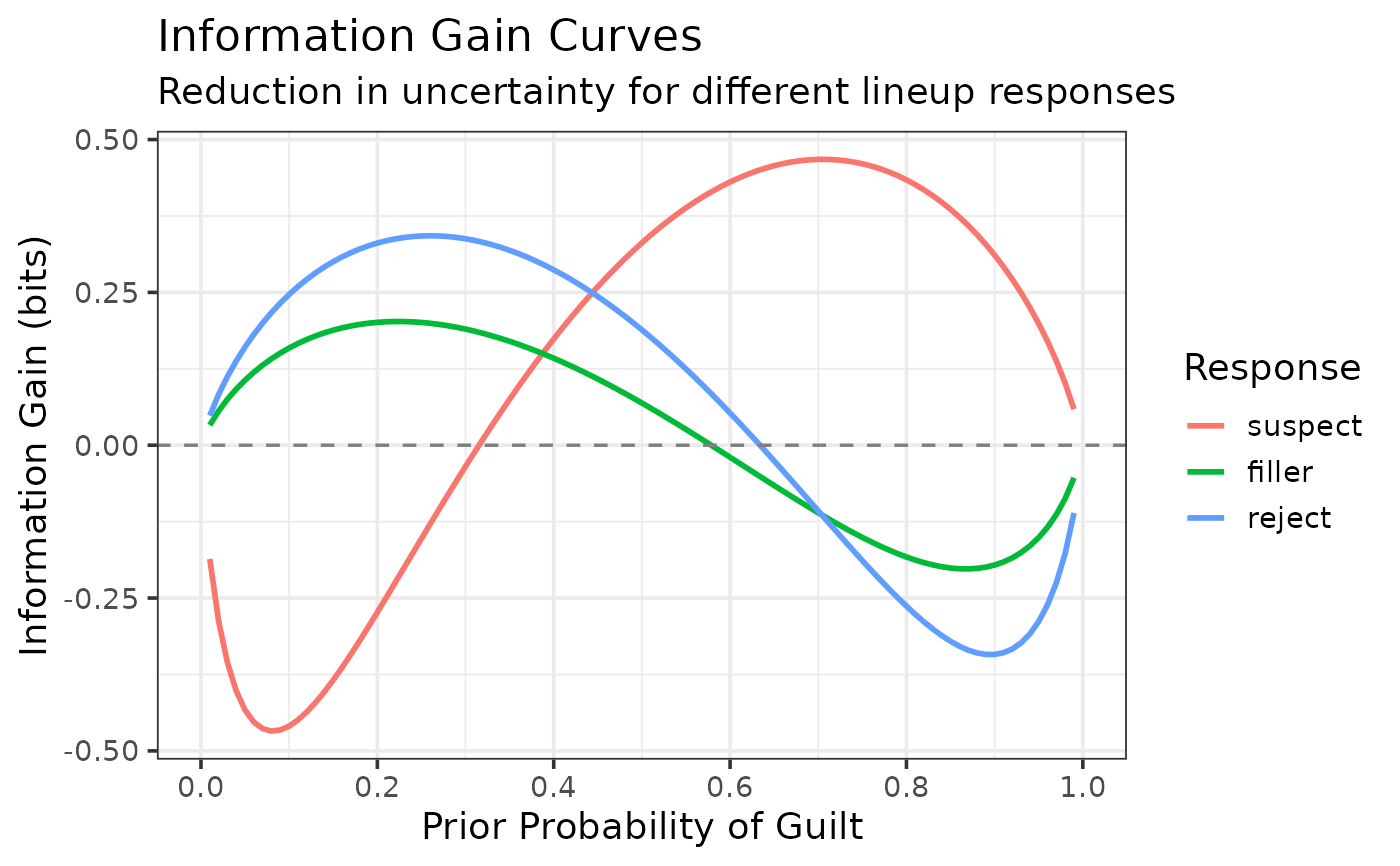
Creates a plot showing how much uncertainty is reduced by different lineup responses.
Details
Information gain curves show the reduction in uncertainty (measured in bits) for each response type across different prior probabilities. A response that points to guilt gains most at priors above 0.5 and one that points to innocence at priors below 0.5; either can be negative where it moves belief towards 0.5. The legend lists responses from the most to the least indicative of guilt.
Examples
data(lineup_example)
bayes <- make_bayes_curves(lineup_example)
plot_bayes_information_gain(bayes)