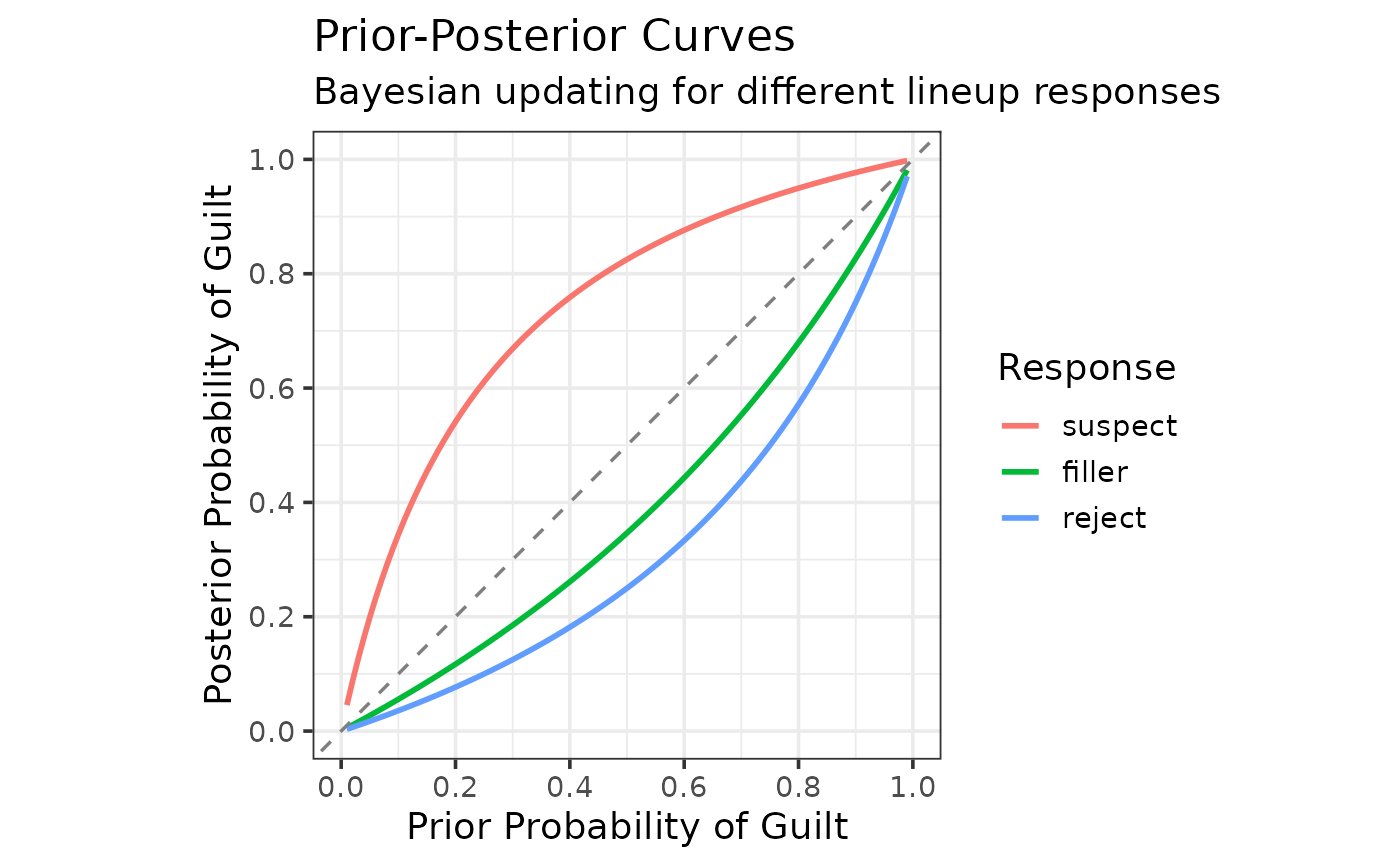
Creates a plot showing how different lineup responses update prior beliefs about suspect guilt to posterior beliefs.
Details
Prior-posterior curves show Bayesian updating for different responses. The diagonal line represents no update (posterior = prior). Curves above the diagonal indicate responses that increase belief in guilt, while curves below decrease belief in guilt.
Examples
data(lineup_example)
bayes <- make_bayes_curves(lineup_example)
plot_bayes_prior_posterior(bayes)