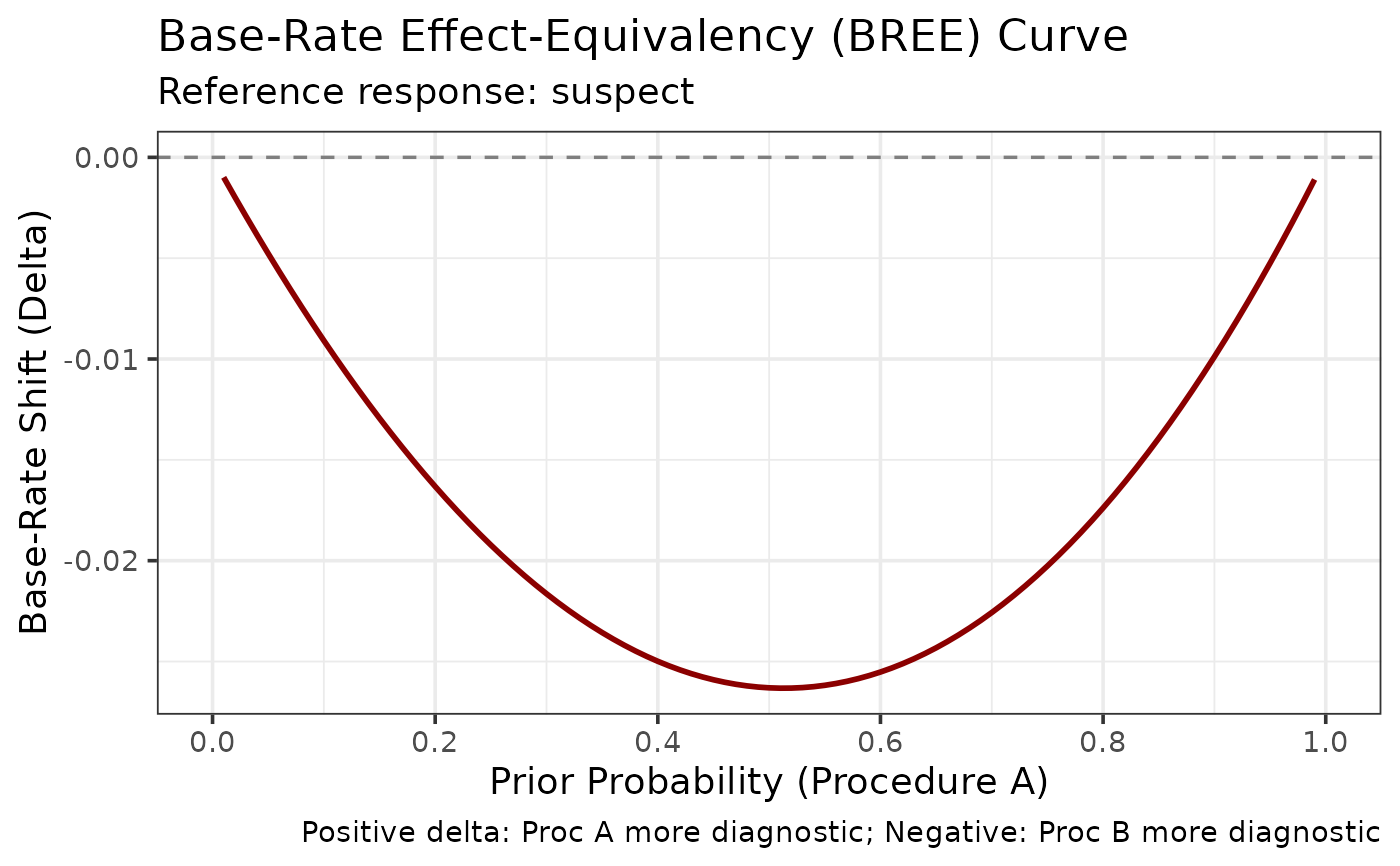
Creates a plot showing the base-rate shift required for one procedure to match another's diagnostic value.
Details
The BREE curve shows how much the base rate (prior probability) would need to shift for Procedure B to yield the same posterior as Procedure A.
Positive delta: Procedure A is more diagnostic (B needs higher base rate to match) Negative delta: Procedure B is more diagnostic (B needs lower base rate to match) Zero delta: Procedures are equally diagnostic
Examples
data(lineup_example)
odd <- seq(1, nrow(lineup_example), by = 2)
bree <- make_bree_curve(lineup_example[odd, ], lineup_example[-odd, ])
plot_bree(bree)