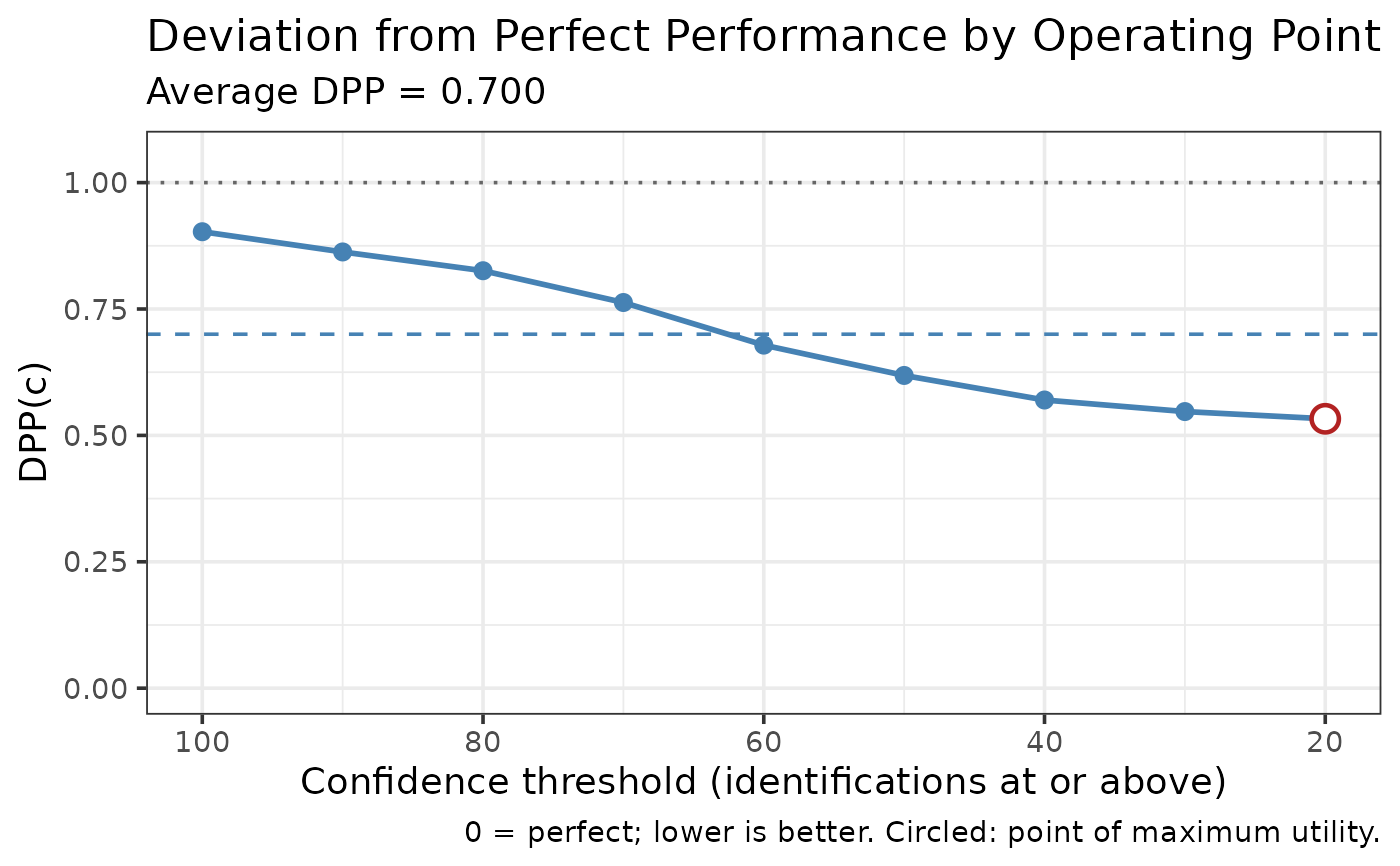
Plots DPP at each operating point of the ROC against the confidence threshold that defines it, with the average marked.
Arguments
- dpp_obj
List output from make_dpp() or compute_dpp()
- show_mean
Logical. Draw the average DPP as a dashed line (default = TRUE)
- show_chance
Logical. Draw the chance reference at DPP = 1, which applies to the unweighted measure only (default = TRUE)
- show_dpp
Logical. Display the average DPP value on the plot (default = TRUE)