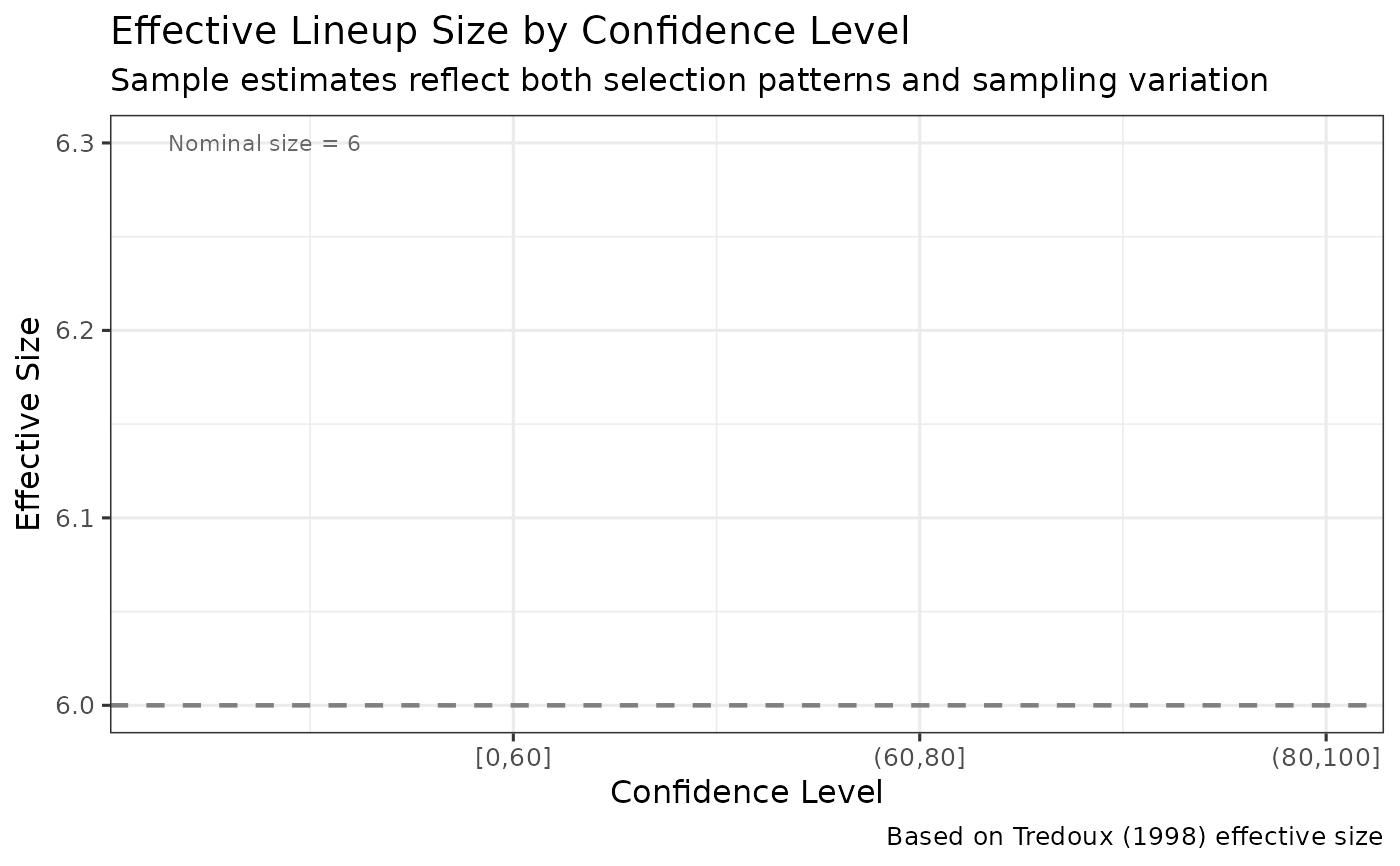
Creates a ggplot visualization showing how effective lineup size varies across confidence levels.
Arguments
- ppv_range_obj
A lineup_ppv_range object from ppv_range_by_confidence(), or a dataframe with columns: confidence, effective_size
- show_nominal
Logical. Whether to show nominal lineup size as reference line (default = TRUE)
- show_points
Logical. Whether to show points at each confidence level (default = TRUE)
Details
Effective size < nominal size indicates lineup bias, where some members are implausible and rarely chosen. This can vary by confidence level if witnesses at different confidence levels have different lineup viewing strategies.
A horizontal line at the nominal lineup size provides a reference. Values below this line indicate bias; values at or above indicate fair lineups.
Examples
data(lineup_example)
ppv_range <- ppv_range_by_confidence(lineup_example,
                                     confidence_bins = c(0, 60, 80, 100))
#> Target-absent lineups contain a designated innocent suspect, so innocent-suspect IDs are counted directly and no lineup-size correction is applied. The nominal, effective and uncorrected estimates are therefore identical for these data. The three diverge only when no innocent suspect is designated and the number of innocent-suspect IDs has to be estimated from the filler IDs.
plot_effective_size_conf(ppv_range)
#> Warning: Removed 3 rows containing missing values or values outside the scale range
#> (`geom_line()`).
#> Warning: Removed 3 rows containing missing values or values outside the scale range
#> (`geom_point()`).