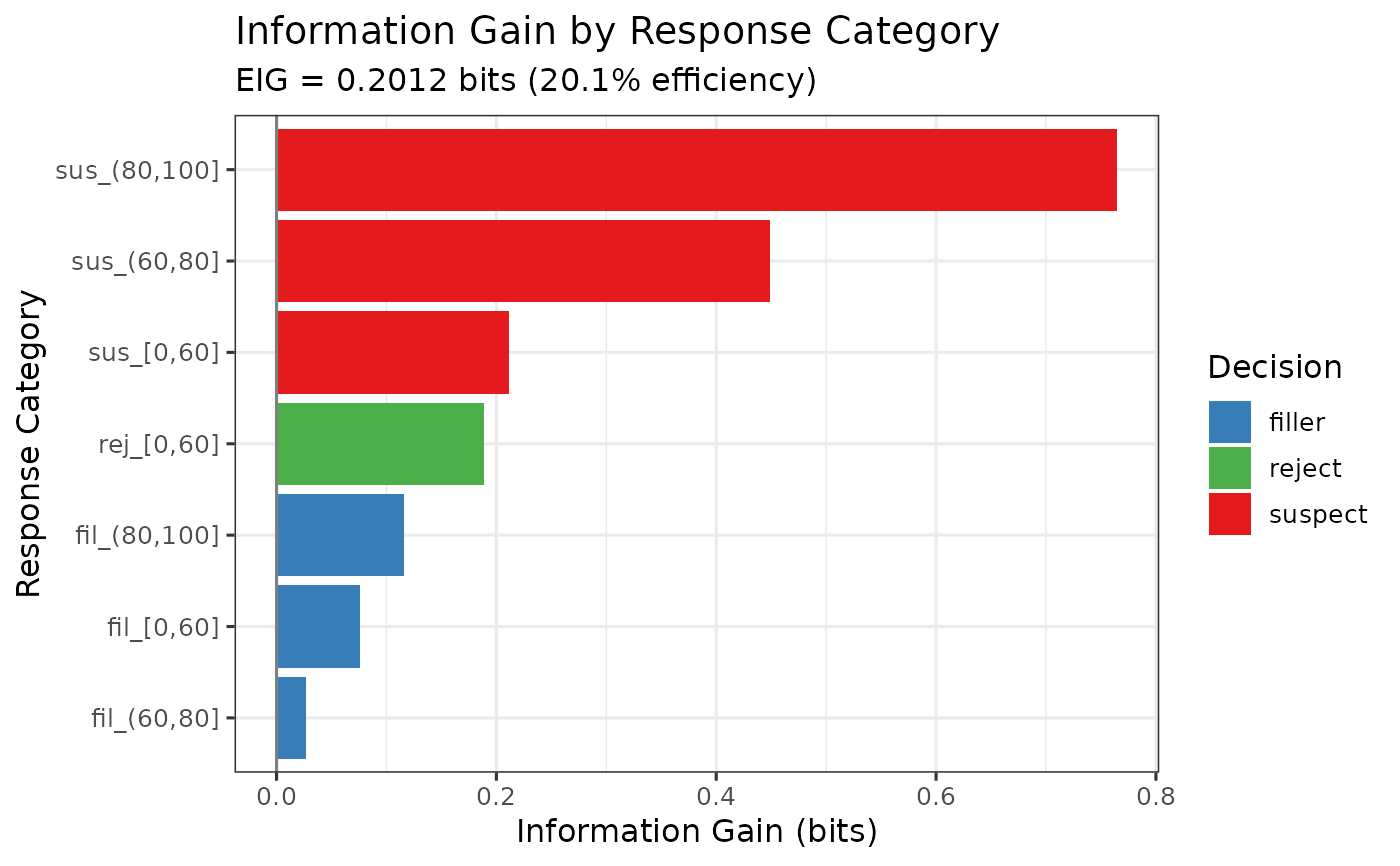
Creates a ggplot2 visualization showing information gain for each response category in an EIG analysis.
Arguments
- eig_obj
A lineup_eig object from compute_eig()
- max_responses
Maximum number of response categories to display (default = 15). Categories are sorted by information gain (highest first).
- color_by
Character. Color bars by "identification" decision or "ig" (information gain). Default = "identification".
Details
This function creates a bar plot showing information gain for each response category. Response categories are ordered by IG (descending), with the most informative responses shown first. Colors distinguish different identification decisions (suspect/filler/reject).
Examples
data(lineup_example)
eig_result <- compute_eig(lineup_example, confidence_bins = c(0, 60, 80, 100))
plot_eig(eig_result)