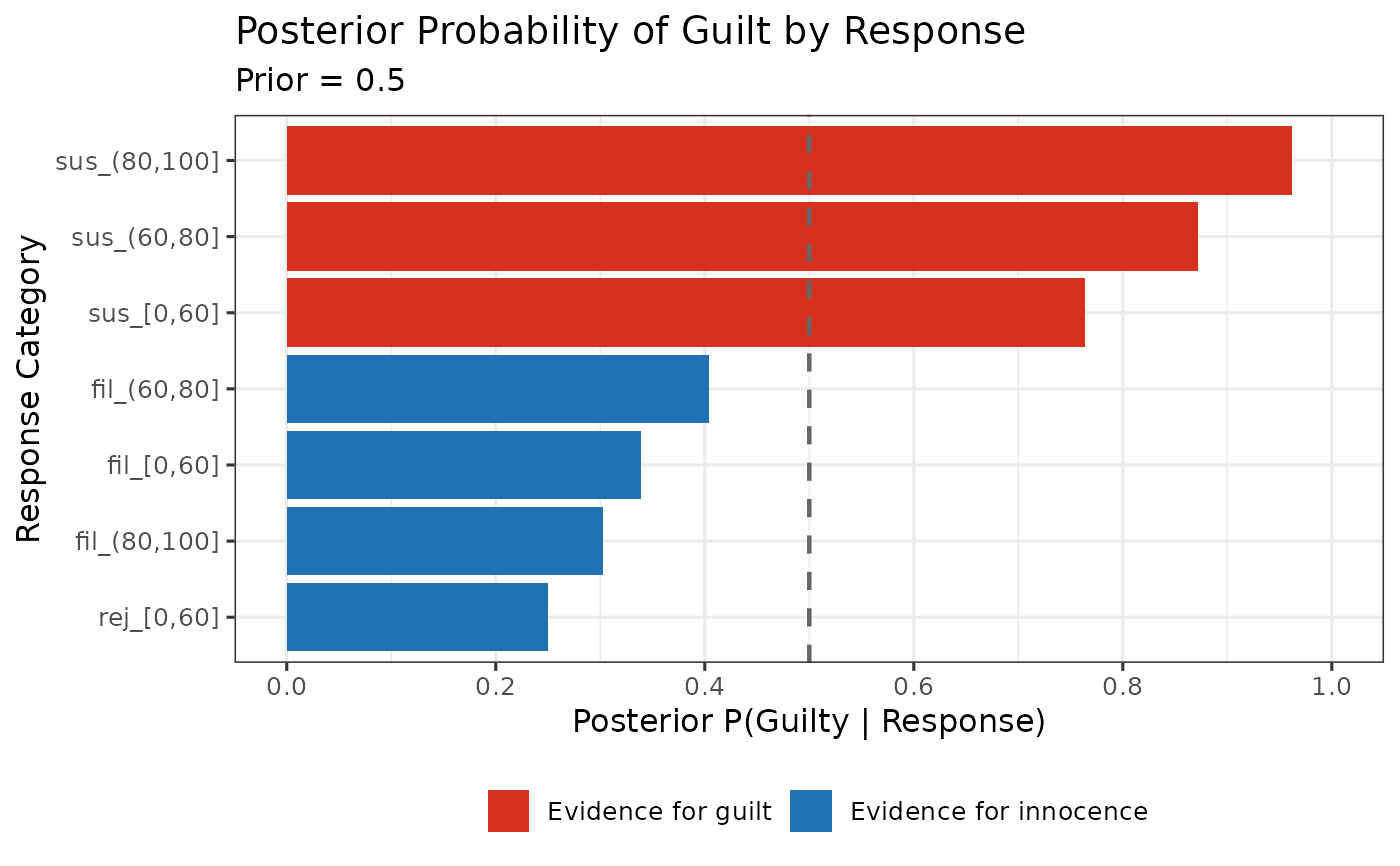
Plot Posterior Probabilities for Response Categories
Source:R/eig_functions.R
plot_eig_posteriors.RdCreates a ggplot2 visualization showing how each response category updates beliefs about guilt (posterior probabilities).
Details
This function creates a bar plot showing the posterior probability of guilt for each response category. The prior probability is shown as a dashed line for reference. Response categories that push beliefs toward guilt (posterior > prior) are colored red, while those pushing toward innocence are colored blue.
Examples
data(lineup_example)
eig_result <- compute_eig(lineup_example, confidence_bins = c(0, 60, 80, 100))
plot_eig_posteriors(eig_result)