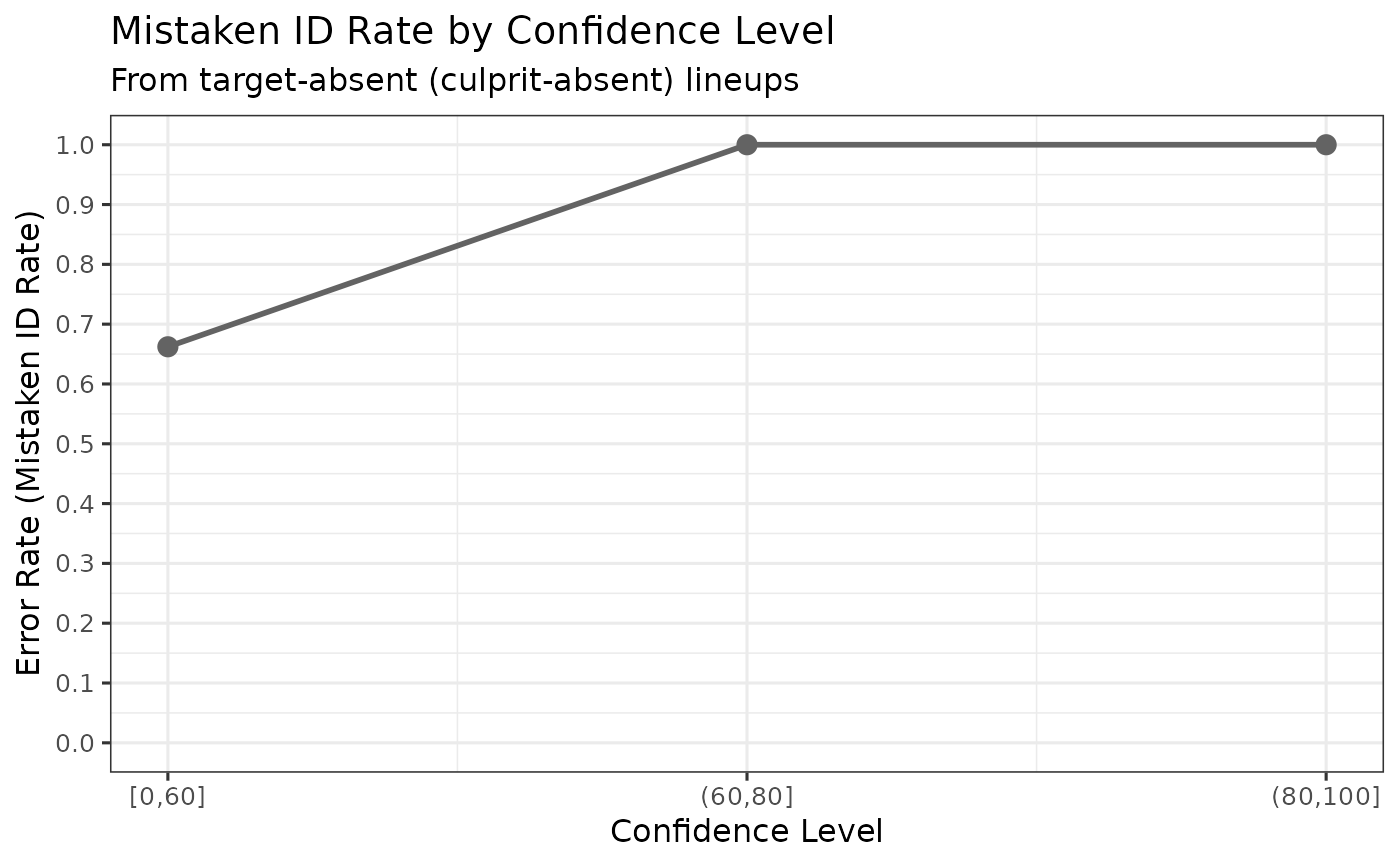
Creates a ggplot visualization showing the mistaken identification rate (from target-absent lineups) across confidence levels.
Details
The error rate is computed from target-absent (culprit-absent) lineups as: (suspect IDs + filler IDs) / total target-absent trials
Higher confidence should generally be associated with lower error rates (better calibration).
Examples
data(lineup_example)
ppv_range <- ppv_range_by_confidence(lineup_example,
                                     confidence_bins = c(0, 60, 80, 100))
#> Target-absent lineups contain a designated innocent suspect, so innocent-suspect IDs are counted directly and no lineup-size correction is applied. The nominal, effective and uncorrected estimates are therefore identical for these data. The three diverge only when no innocent suspect is designated and the number of innocent-suspect IDs has to be estimated from the filler IDs.
plot_error_rate_conf(ppv_range)