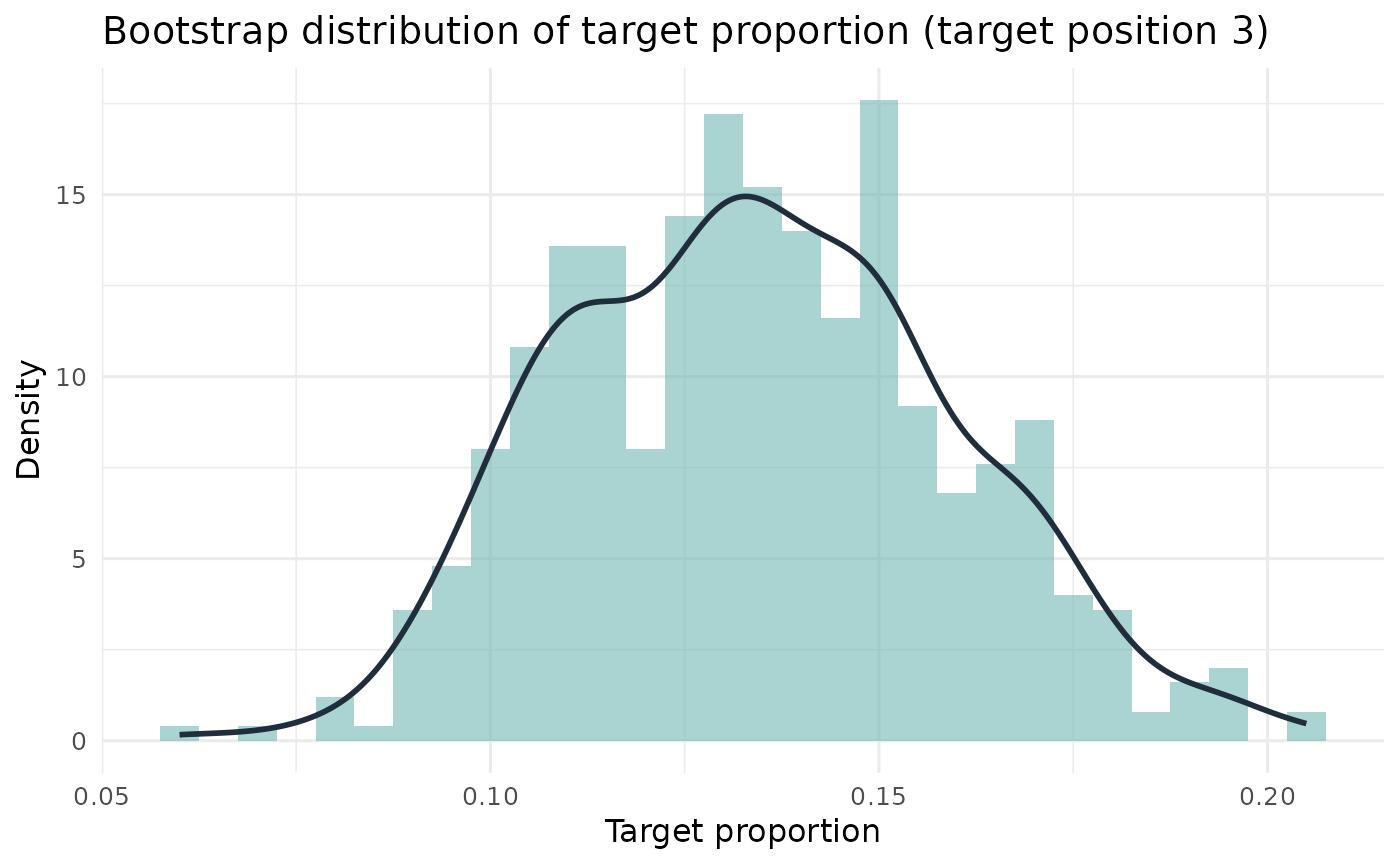
Plot Bootstrap Distribution of Lineup Bias
Source:R/bias_effective_distributions.R
plot_lineup_bias_distribution.RdPlot Bootstrap Distribution of Lineup Bias
Arguments
- boot_values
Numeric vector of bootstrap estimates, as returned by
lineup_bias_boot_dist.- target_pos
Optional target position label for title.
- bins
Number of histogram bins. Defaults to
NULL, which selects the bin width automatically (see Details).- binwidth
Histogram bin width. Defaults to
NULL, which selects the bin width automatically (see Details). Takes precedence overbins.
Details
Bootstrap estimates of a lineup proportion are counts divided by the
number of lineup choices, so they fall on a discrete lattice with spacing
1/n rather than on a continuum. Binning such values at an arbitrary
resolution produces a misleading histogram: bins that contain no attainable
value are empty regardless of the data, and bins that happen to straddle two
attainable values are twice as tall as their neighbours. When neither
bins nor binwidth is supplied, the lattice spacing is
recovered (from the "n" attribute when present, otherwise from the
values themselves) and used as the bin width, so each bar covers exactly one
attainable proportion. Estimates that are effectively continuous fall back
to 30 bins.
Examples
vec <- round(runif(200, 1, 6))
dist <- lineup_bias_boot_dist(vec, target_pos = 3, k = 6, R = 500)
plot_lineup_bias_distribution(dist, target_pos = 3)