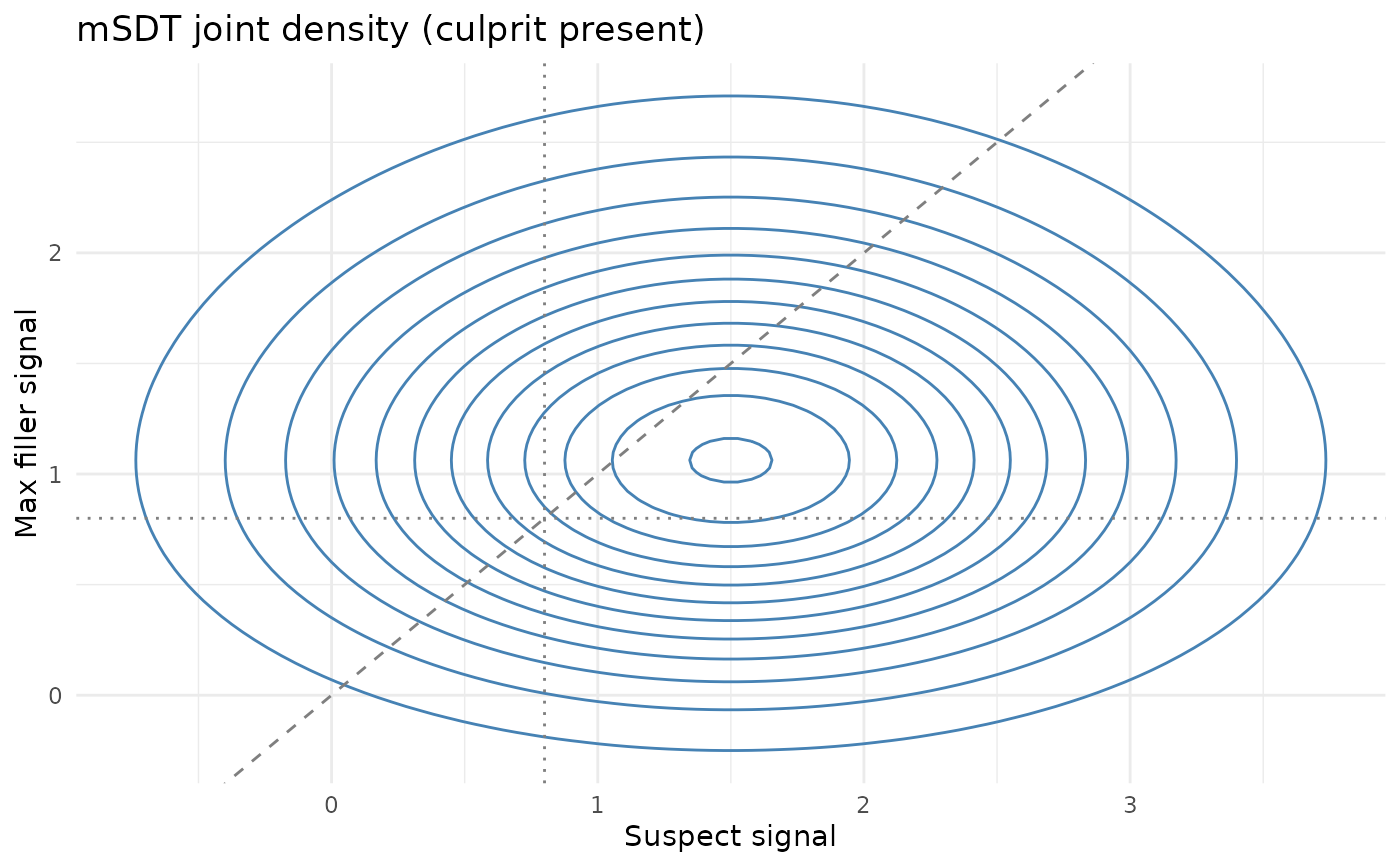
Contour plot of the joint distribution of suspect signal and max filler signal.
Usage
plot_msdt_joint(
  dprime,
  gamma,
  lineup_size,
  lineup_type = c("culprit_present", "culprit_absent"),
  n = 120,
  xlim = NULL,
  ylim = NULL,
  show_decision = TRUE
)
Arguments
- dprime
Discriminability between guilty and innocent suspects.
- gamma
Decision criterion.
- lineup_size
Lineup size (suspect + fillers), must be >= 2.
- lineup_type
Either "culprit_present" or "culprit_absent".
- n
Grid resolution per axis.
- xlim, ylim
Optional numeric ranges for axes.
- show_decision
Logical. If TRUE, overlays MAX rule boundaries.