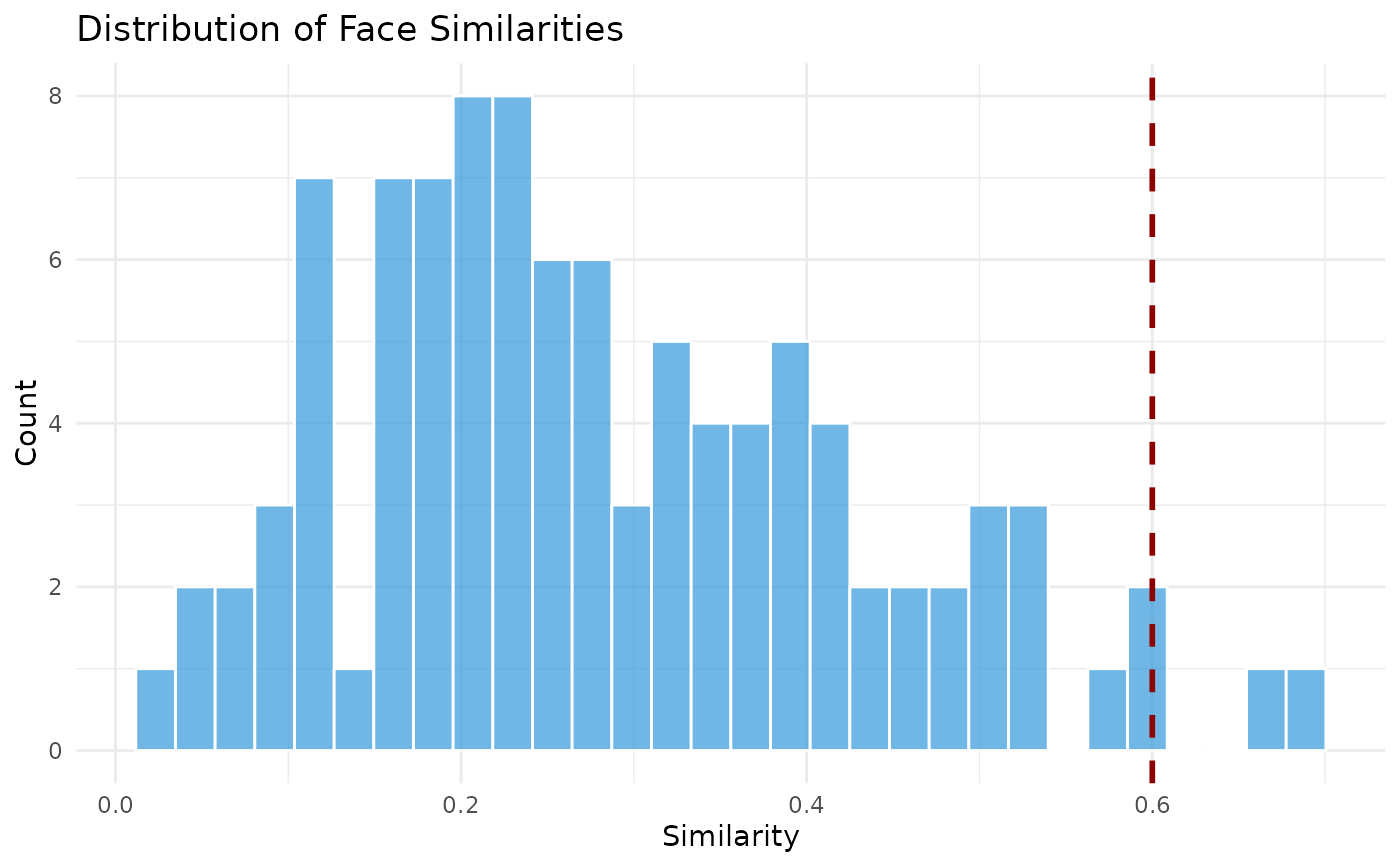
Creates a histogram or density plot showing the distribution of face similarities, useful for understanding the range of similarities in a lineup or database.
Usage
plot_similarity_distribution(
  similarities,
  type = c("histogram", "density"),
  threshold = NULL,
  xlab = "Similarity",
  title = "Distribution of Face Similarities"
)