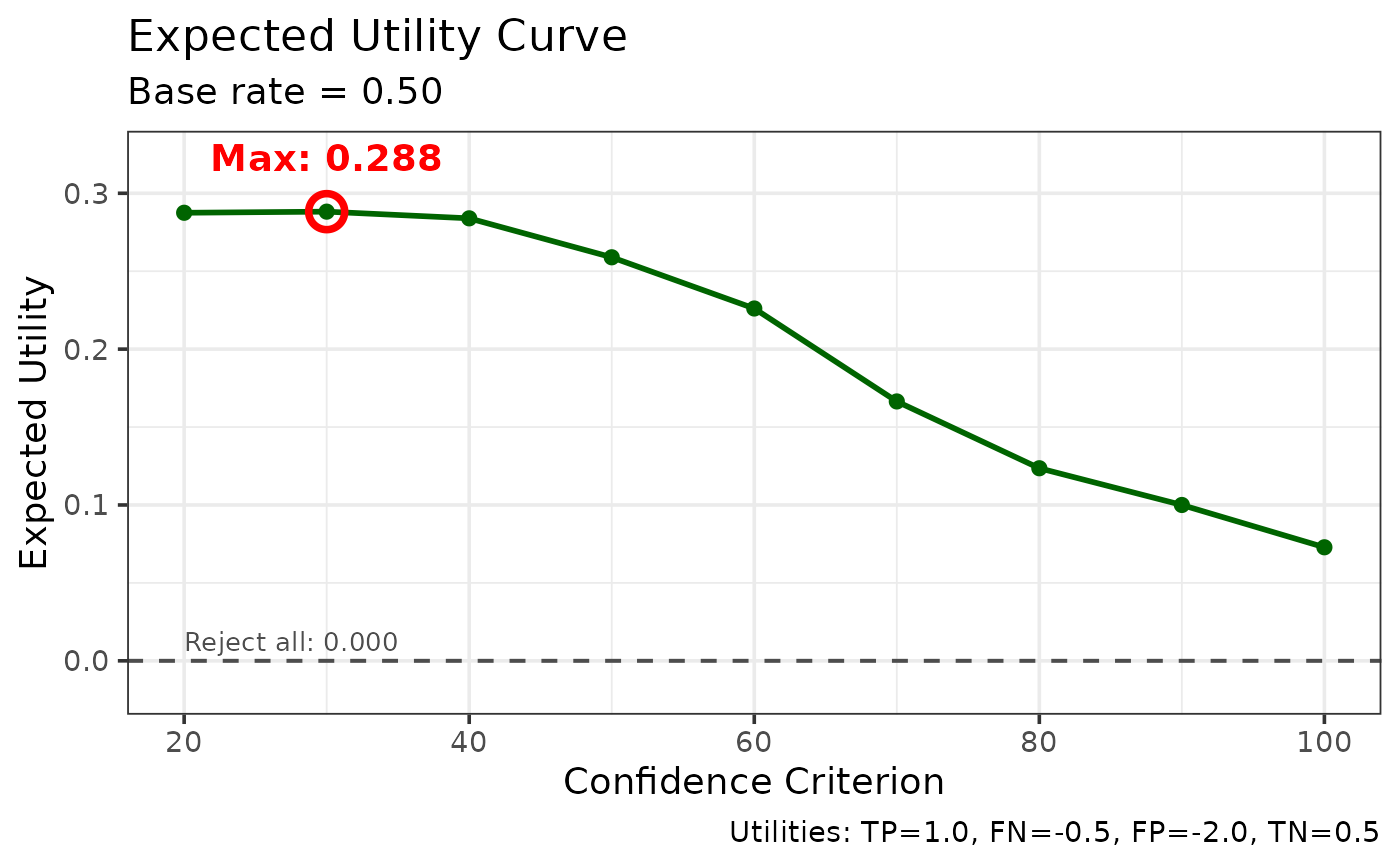
Creates a plot showing expected utility across confidence criteria.
Details
The utility curve shows the expected utility at each confidence criterion. Higher confidence criteria have lower hit rates but also lower false alarm rates. The optimal criterion maximizes expected utility given the base rate and cost structure.
Examples
data(lineup_example)
util <- make_utility_curves(lineup_example)
plot_utility_curves(util)