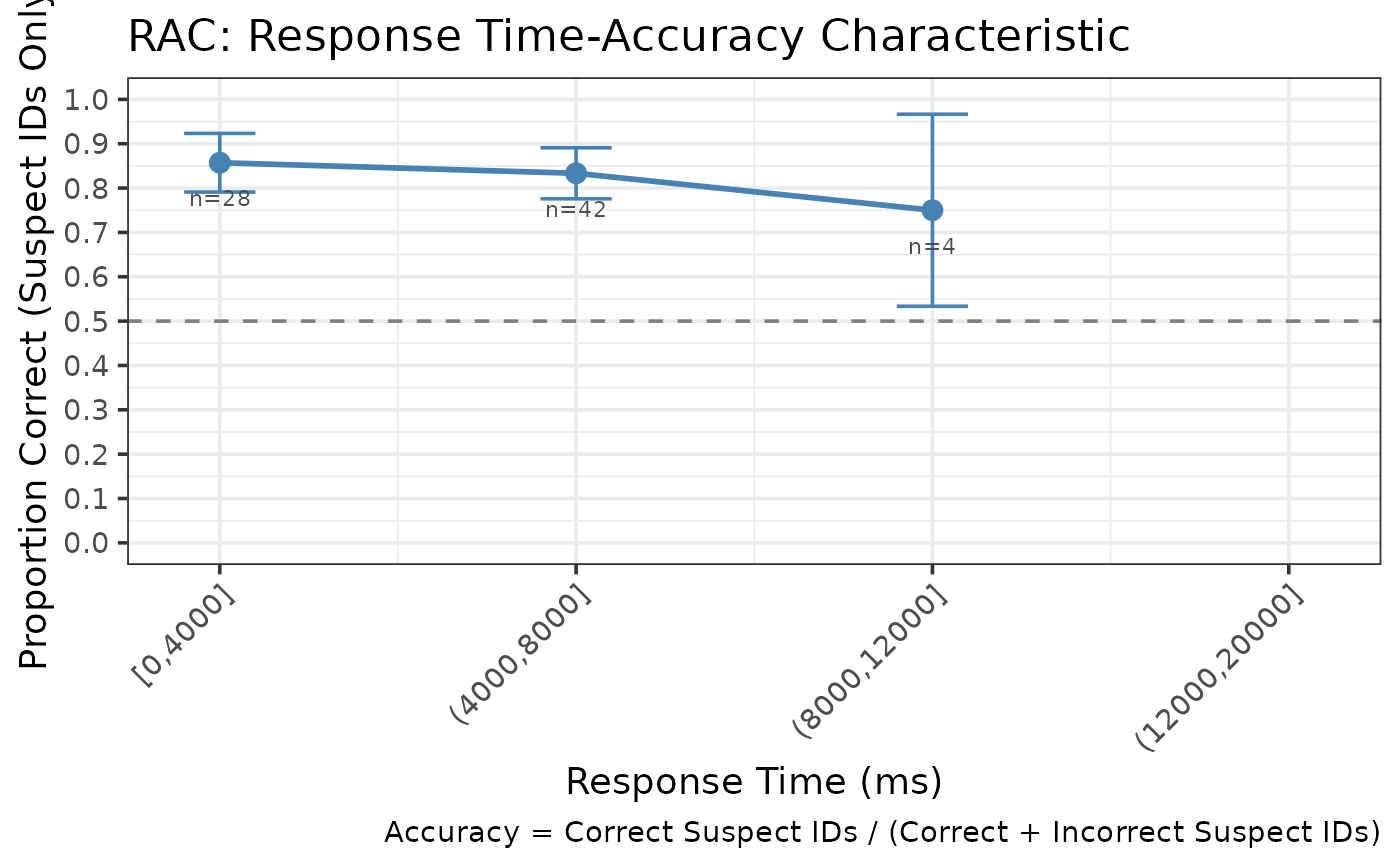
Creates a ggplot2 visualization of RAC data showing the relationship between response time and accuracy.
Examples
data <- create_example_lineup_data(n_trials = 200,
                                   include_response_time = TRUE,
                                   seed = 123)
rac <- make_racdata(data, time_bins = c(0, 4000, 8000, 12000, 20000))
make_rac_gg(rac)
#> Warning: Removed 1 row containing missing values or values outside the scale range
#> (`geom_line()`).
#> Warning: Removed 1 row containing missing values or values outside the scale range
#> (`geom_point()`).
#> Warning: Removed 1 row containing missing values or values outside the scale range
#> (`geom_text()`).