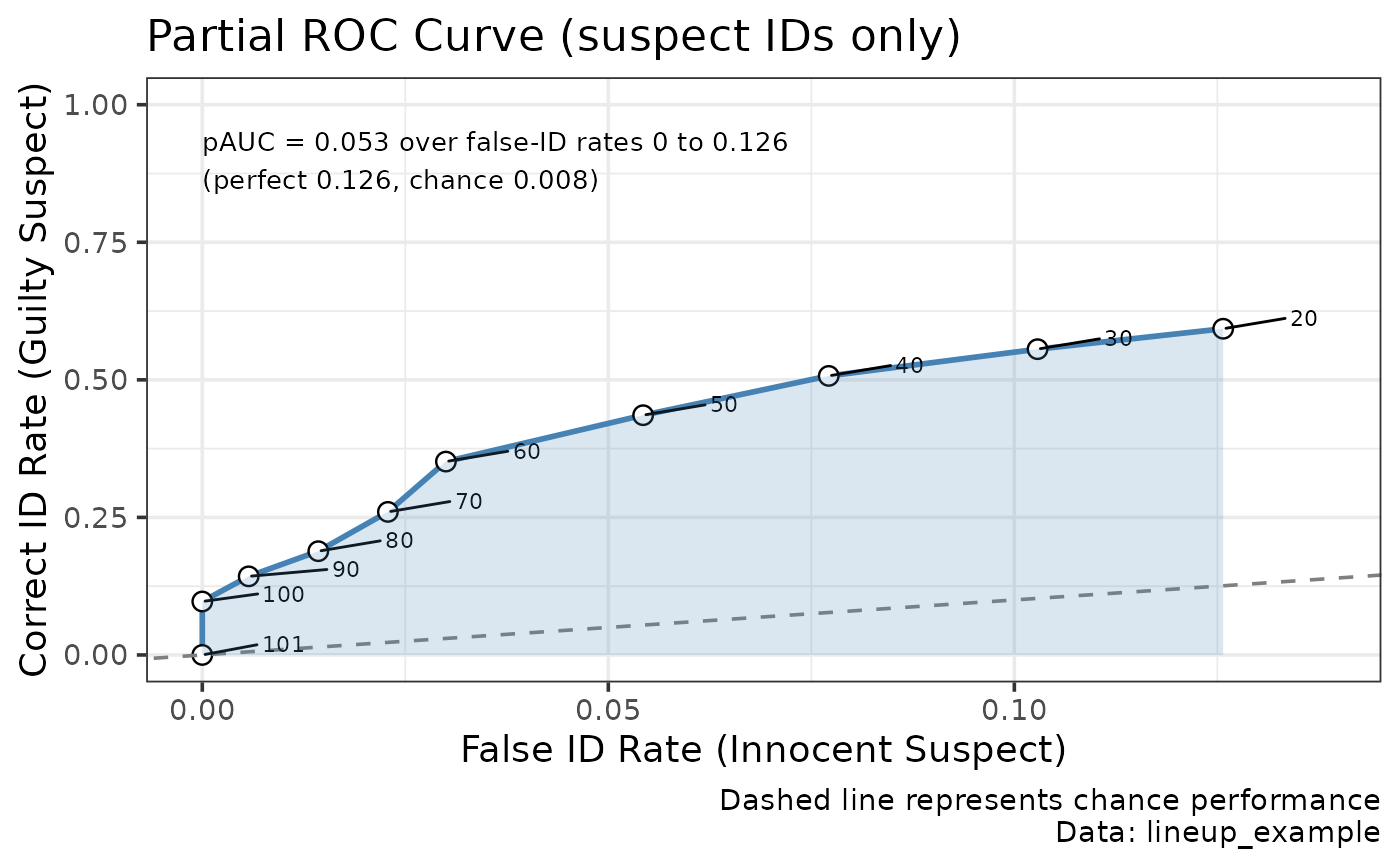
Creates a ggplot2 visualization of ROC data from lineup identification experiments.
Usage
make_roc_gg(
  rocobj_list,
  show_pauc = TRUE,
  point_labels = TRUE,
  title = "Partial ROC Curve (suspect IDs only)",
  data_source = NULL
)
Arguments
- rocobj_list
List output from make_rocdata(), or the lineup_roc object from make_roc()
- show_pauc
Logical. Whether to display pAUC value on plot (default = TRUE)
- point_labels
Logical. Whether to label points with confidence levels (default = TRUE)
- title
Character. Plot title. The default names the ROC variant, so that a partial ROC is not mistaken for a full ROC (see
plot_fullroc).- data_source
Character. Name of the dataset the curve was computed from, appended to the caption. Defaults to the
"data_source"attribute recorded bymake_rocdata, and is omitted when unavailable.
Value
A ggplot2 object. Being an ordinary ggplot, it can be modified with
the usual + syntax, e.g. p + ggplot2::theme_minimal().
Examples
data(lineup_example)
roc <- make_rocdata(lineup_example)
make_roc_gg(roc)