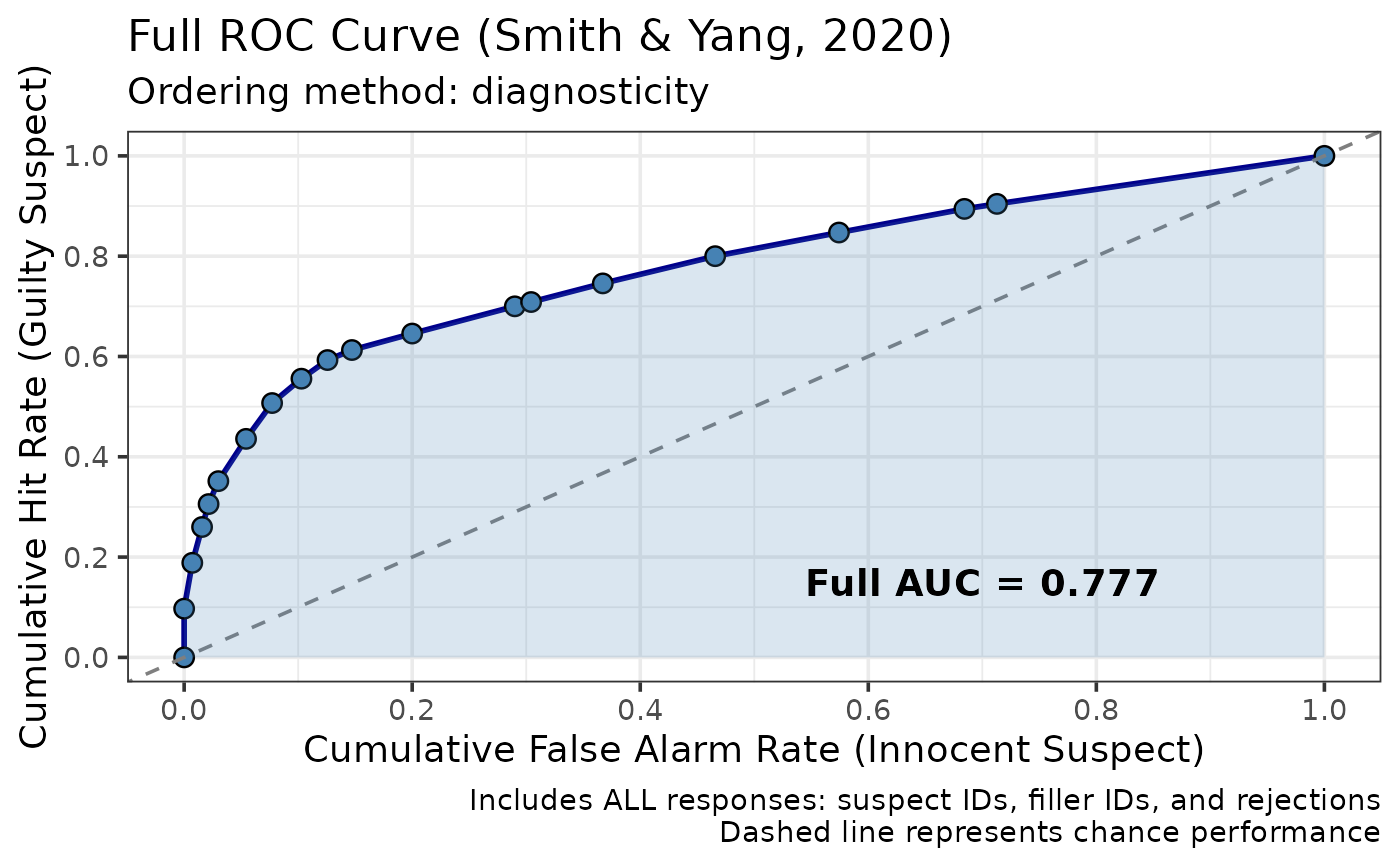
Creates a ggplot2 visualization of full ROC data from lineup identification experiments using the Smith & Yang (2020) method.
Usage
plot_fullroc(
  fullroc_obj,
  show_auc = TRUE,
  point_labels = FALSE,
  title = "Full ROC Curve (Smith & Yang, 2020)"
)
Arguments
- fullroc_obj
Either the list returned by
make_fullroc_data()or thelineup_fullrocobject returned bymake_fullroc(). The two record the ordering method in different places, and both are accepted.- show_auc
Logical. Whether to display AUC value on plot (default = TRUE)
- point_labels
Logical. Whether to label points (default = FALSE, can be crowded)
- title
Character. Plot title (default = "Full ROC Curve (Smith & Yang, 2020)")
Value
A ggplot2 object. Being an ordinary ggplot, it can be modified with
the usual + syntax, e.g. p + ggplot2::theme_minimal().
Examples
data(lineup_example)
fullroc_result <- make_fullroc_data(lineup_example)
#> Ordering categories by their sample diagnosticity ratios is optimistically biased: the ordering is estimated from the same data used to compute the AUC. With roughly 700 lineups per arm the bias can be substantial. Use order = "apriori" for inference or between-condition comparisons; see vignette("fullroc_analysis").
plot_fullroc(fullroc_result)