Plot a Multi-d' Analysis
Arguments
- x
An object of class
"multid"frommake_multid.- type
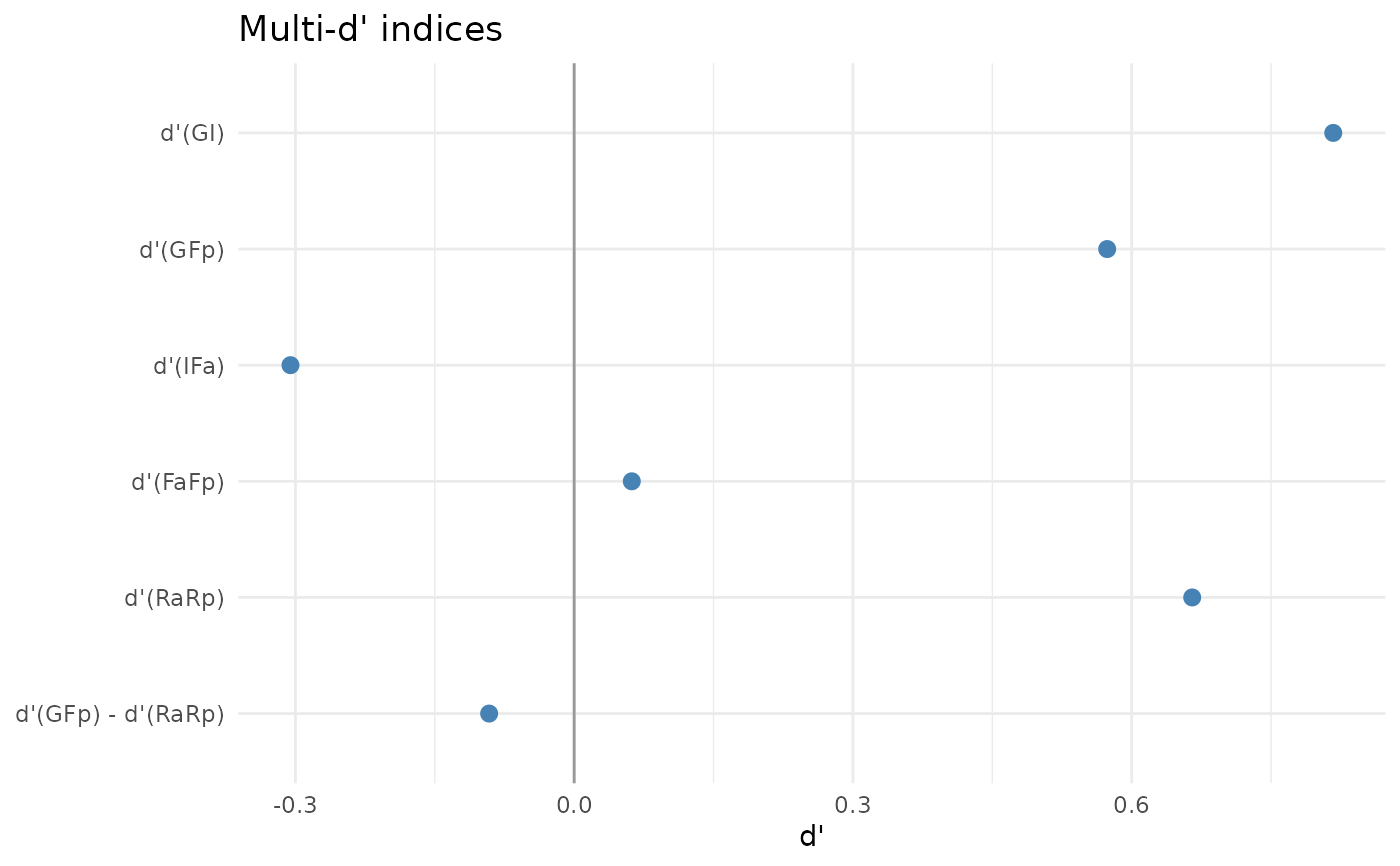
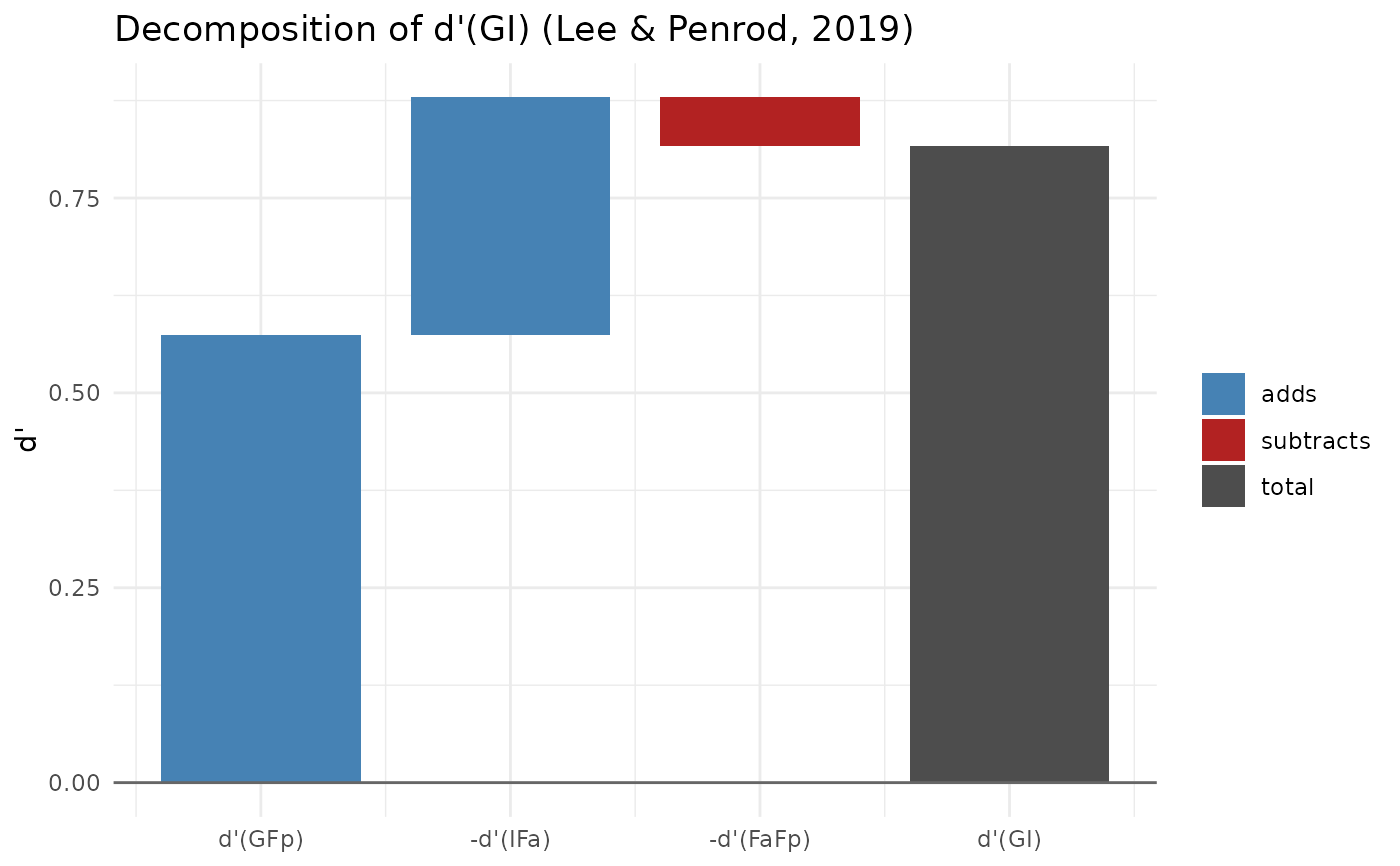
"decomposition"(default) shows d'(GFp), -d'(IFa) and -d'(FaFp) as a waterfall summing to d'(GI)."indices"plots each index, with bootstrap intervals when available."confidence"plots the cumulative indices against confidence threshold (requiresby_confidence = TRUE).- ...
Unused.
Examples
md <- make_multid(counts = c(G = 45, Fp = 24, Rp = 31, I = 17, Fa = 26, Ra = 57))
plot(md)
 plot(md, type = "indices")