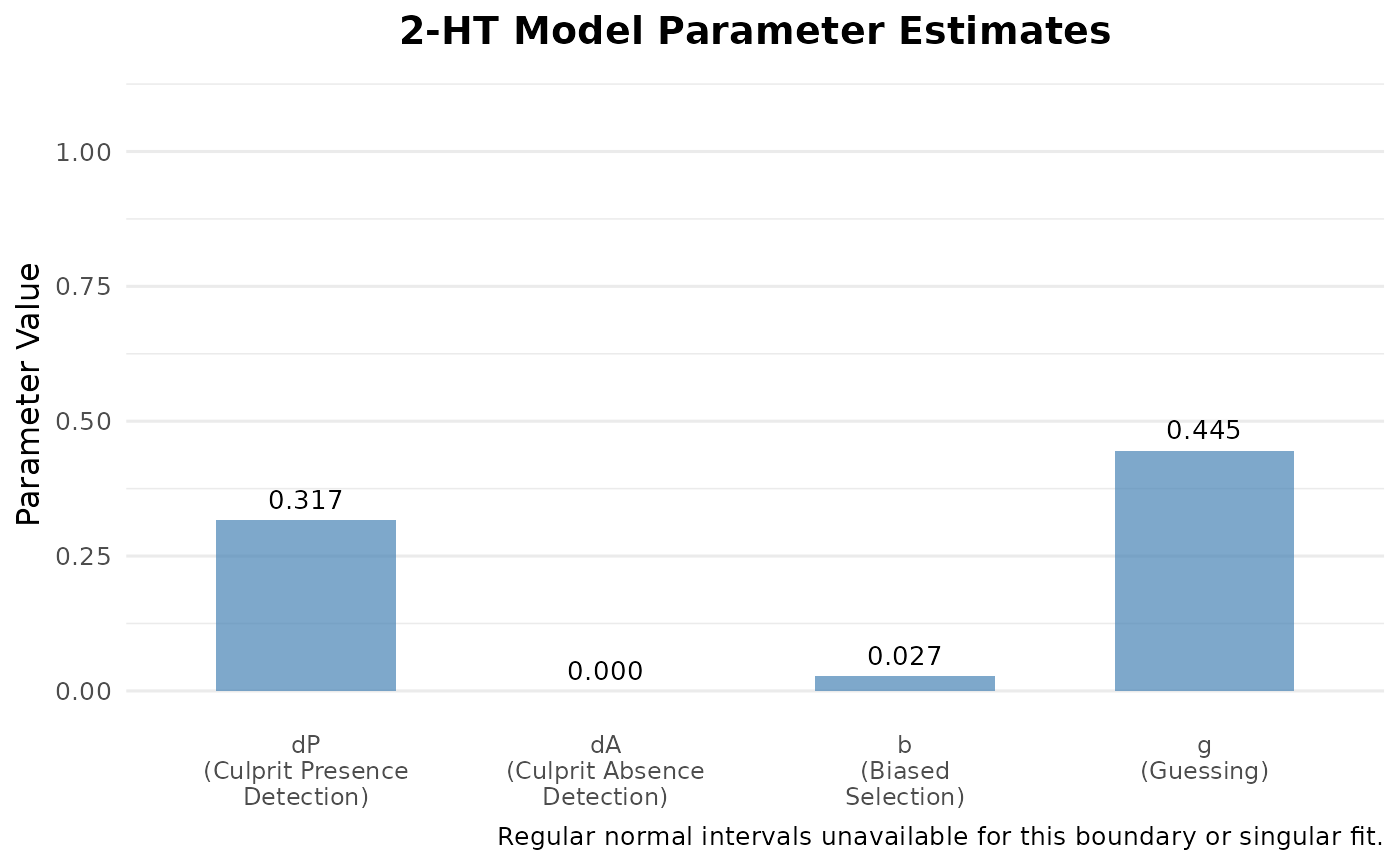
Creates a visual display of the parameter estimates from a fitted 2-HT model, with error bars showing the supplied bootstrap intervals, or regular 95% normal intervals where available.
Usage
plot_2ht_parameters(x, ..., which = c("dP", "dA", "b", "g"), show_ci = TRUE)Arguments
- x
A
winter_2htobject, or awinter_2ht_bootobject fromboot_winter_2ht. Given the latter, the plotted intervals are the bootstrap percentile intervals; given the former they are normal approximations clamped to [0, 1]. from fit_winter_2ht()- ...
Additional arguments passed to plotting functions
- which
Character vector specifying which parameters to plot. Default is c("dP", "dA", "b", "g") (all parameters).
- show_ci
Logical indicating whether to show 95% confidence intervals. Default is TRUE.
Examples
counts <- c(
  n_tp_suspect = 147, n_tp_filler = 94, n_tp_reject = 141,
  n_ta_suspect = 38, n_ta_filler = 138, n_ta_reject = 206
)
fit <- fit_winter_2ht(counts, lineup_size = 6)
#> Warning: 2-HT estimate is on a parameter boundary; regular Hessian standard errors are unavailable. Bootstrap intervals also need boundary qualification.
plot_2ht_parameters(fit)