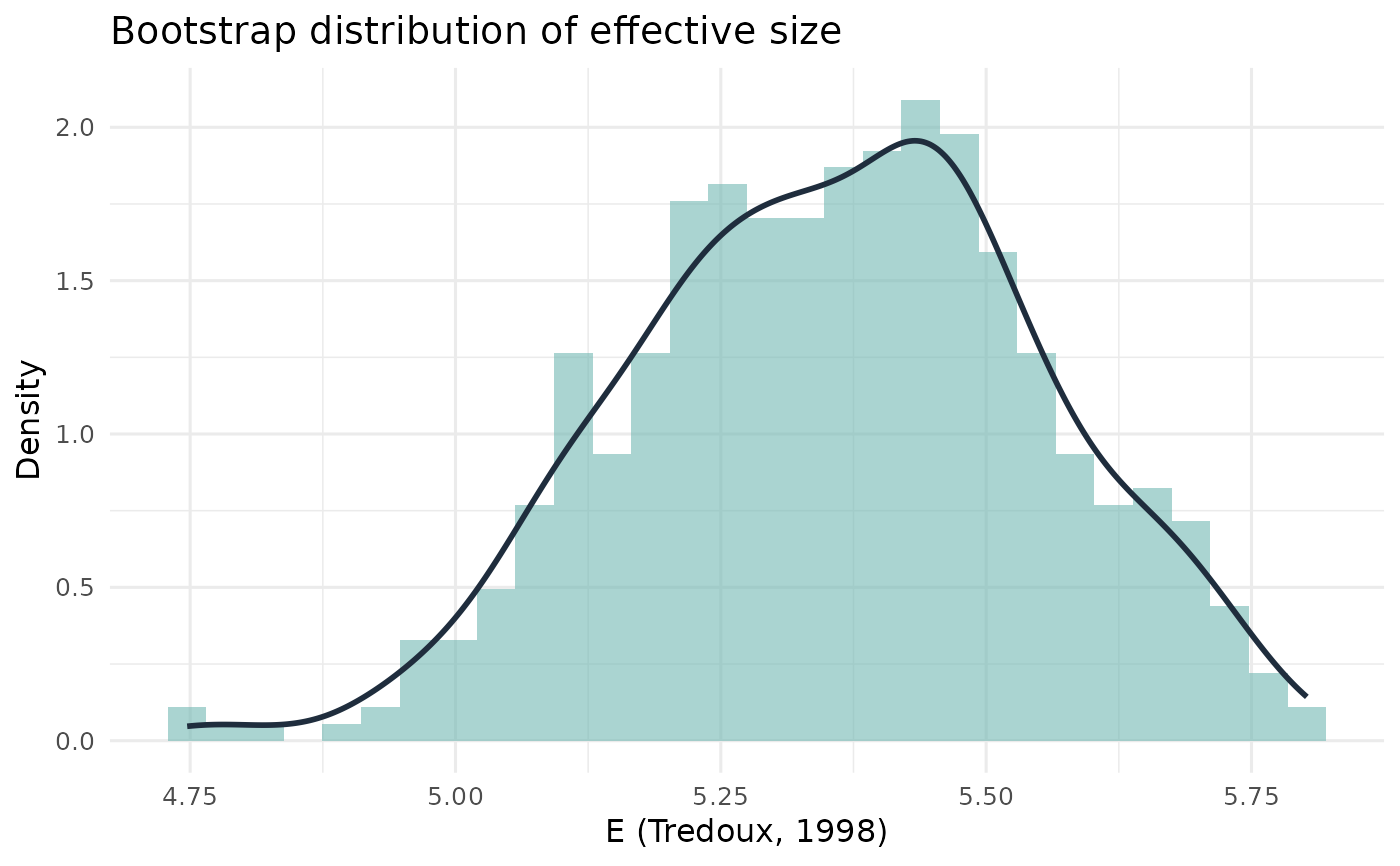
Plot Bootstrap Distribution of Effective Size
Source:R/bias_effective_distributions.R
plot_esize_distribution.RdPlot Bootstrap Distribution of Effective Size
Usage
plot_esize_distribution(
  boot_values,
  metric = "Effective size",
  bins = NULL,
  binwidth = NULL
)
Arguments
- boot_values
Numeric vector of bootstrap estimates, as returned by
esize_boot_dist.- metric
Label for the effective size statistic.
- bins
Number of histogram bins. Defaults to
NULL, which selects the bin width automatically.- binwidth
Histogram bin width. Defaults to
NULL, which selects the bin width automatically. Takes precedence overbins.
Details
Effective size is a function of the whole table of choices, so its
bootstrap distribution is usually fine-grained enough to bin as a continuous
quantity, and the default is then 30 bins. When the number of lineup choices
is small the estimates become visibly discrete, and the automatic rule bins
at the resolution of the attainable values instead. See
plot_lineup_bias_distribution for the rationale.
Examples
vec <- round(runif(200, 1, 6))
dist <- esize_boot_dist(vec, k = 6, metric = "tredoux", R = 500)
plot_esize_distribution(dist, metric = "E (Tredoux, 1998)")