Generates simulated eyewitness lineup data based on signal detection theory parameters. Useful for power analysis, method validation, and teaching.
Usage
simulate_lineup_data(
  n_tp = 100,
  n_ta = 100,
  d_prime = 1.5,
  c_criterion = 0,
  lineup_size = 6,
  conf_levels = 5,
  decision_rule = c("max", "best_rest", "ensemble", "integration"),
  foil_bias = NULL,
  include_response_time = FALSE,
  seed = NULL
)
Arguments
- n_tp
Integer. Number of target-present lineups (default = 100)
- n_ta
Integer. Number of target-absent lineups (default = 100)
- d_prime
Numeric. Discriminability (d') between target and lure distributions. Higher values = better memory. Typical range: 0.5 to 3.0 (default = 1.5)
- c_criterion
Numeric scalar or vector of ordered decision criteria. The first value is always the identification/rejection threshold. With confidence ratings, a scalar generates
conf_levelsthresholds fromc_criterionthroughc_criterion + 2; alternatively, supply exactly one strictly increasing threshold per confidence level. Lower values are more liberal (default = 0).- lineup_size
Integer. Number of lineup members (default = 6)
- conf_levels
Integer. Number of confidence levels to simulate. If NULL, returns binary decision only (default = 5)
- decision_rule
Character. Decision strategy for lineup choices:
"max" - Independent observations, choose highest strength (default)
"best_rest" - Best strength minus the mean of the other members
"ensemble" - Best strength minus the mean of all lineup members
"integration" - Sum memory strengths across all members
- foil_bias
Numeric vector of length
lineup_size - 1, giving the mean memory strength of each foil. Defaults toNULL, which places every foil atN(0, 1). Supplying a vector makes the foils differ in how plausible they are, so that they are no longer interchangeable. Values are means on the same scale asd_prime: a foil at0.5is chosen more often than one at-0.5, and a strongly negative value produces a foil that is rarely or never chosen — a null foil.- include_response_time
Logical. Whether to simulate response times correlated with memory strength (default = FALSE)
- seed
Integer. Random seed for reproducibility (default = NULL)
Value
A dataframe with columns:
participant_id: Unique ID for each trial
target_present: Logical. TRUE if target in lineup
lineup_member: Integer. Position of the lineup member actually chosen, or 0 for a rejection. Each foil is simulated separately and retains its own identity; foils are not treated as interchangeable
suspect_pos: Integer. Position occupied by the suspect (1 by construction; the target in target-present lineups, the designated innocent suspect in target-absent lineups)
identification: Character. "suspect", "filler", or "reject", derived from lineup_member and suspect_pos. See
classify_lineup_choicesconfidence: Numeric (if conf_levels specified). Confidence rating
response_time: Numeric (if include_response_time = TRUE). RT in ms
Details
This function implements signal detection models with multiple decision rules:
Target distribution: Normal(d_prime, 1)
Lure distribution: Normal(0, 1)
Decision: Depends on decision_rule parameter
Decision Rules:
MAX (default): Independent observations model. Choose lineup member with highest memory strength (Clark, 2003).
BEST-REST: Best strength minus the average of the remaining members (Clark, 2003).
Ensemble: Best strength minus the average of all lineup members (Wixted et al., 2018). For lineup size \(k\), this is \((k - 1) / k\) times BEST-REST, so the two are equivalent model parameterizations when their criteria are rescaled by the same factor.
Integration: Sum memory strengths across all lineup members. Represents complete integration of evidence (Wixted et al., 2018).
All rules use independent signals with target distribution \(N(d', 1)\) and filler distribution \(N(0, 1)\). Thus, this simulator represents the equal-variance, zero-correlation special case of the lineup models. It does not implement the shared-variance or unequal-variance likelihood models fitted by Wixted et al. (2018).
The simulation assumes:
Fair lineups (all fillers equally similar to description)
Perfect attention (no guessing without memory)
Normal distributions for memory strength
Response times (if simulated) are a heuristic convenience, not a fitted reaction-time or drift-diffusion model:
Faster for stronger memory signals
A bounded noisy function of decision strength
Foil identity
Memory strengths are drawn independently for every lineup member, so the
foils are distinguishable and are not exchangeable. lineup_member
preserves which member was chosen; identification is a derived
summary of it. Analyses that need member-level information (for example the
effective-size correction in make_ppv_range) can therefore use
lineup_member directly rather than working from the collapsed labels.
References
Wixted, J. T., Vul, E., Mickes, L., & Wilson, B. M. (2018). Models of lineup memory. Cognitive Psychology, 105, 81–114. doi:10.1016/j.cogpsych.2018.06.001
Mickes, L., et al. (2024). pyWitness 1.0: A python eyewitness identification analysis toolkit. Behavior Research Methods, 56, 1533-1550.
Examples
# Basic simulation: strong memory with MAX rule (default)
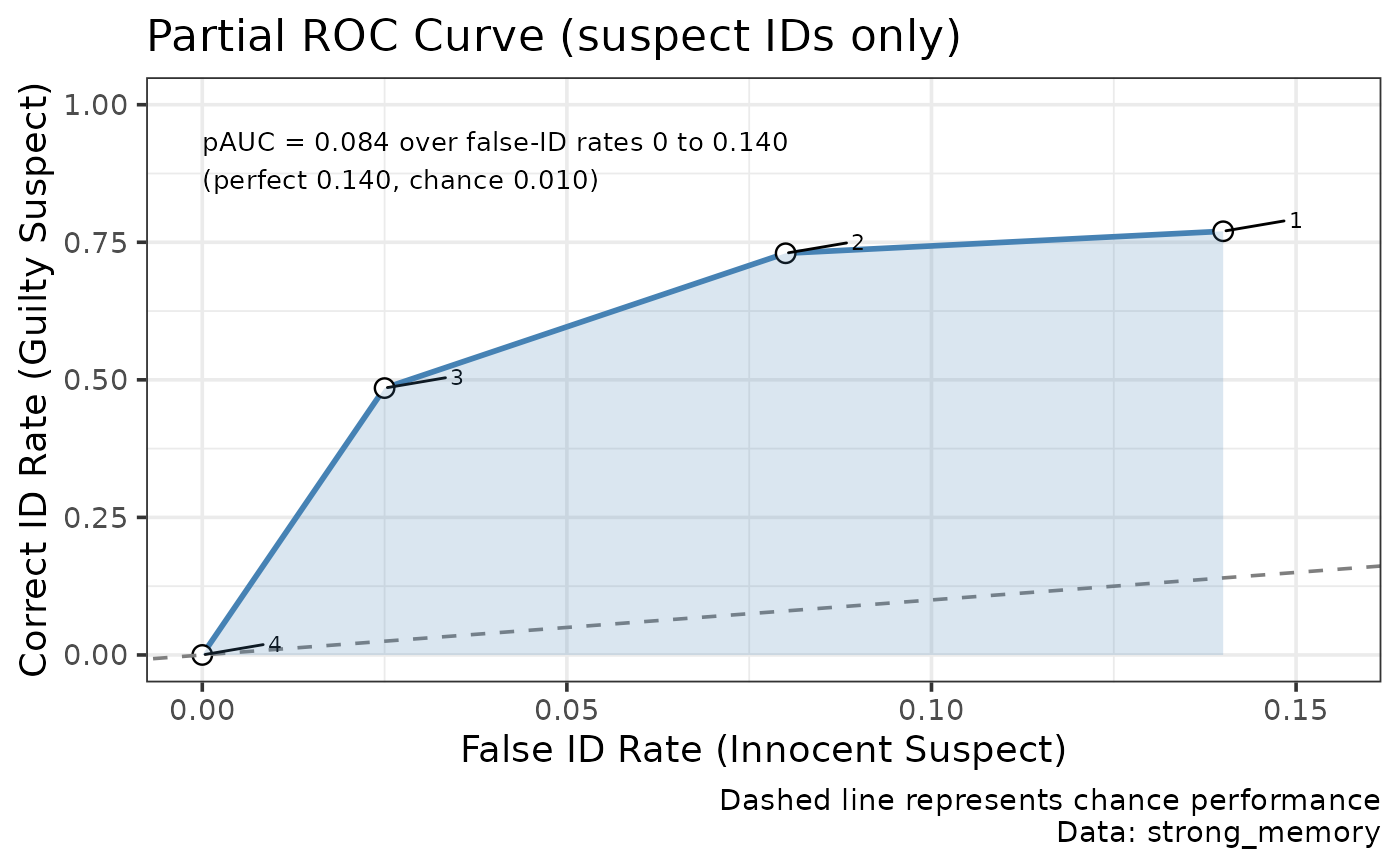
strong_memory <- simulate_lineup_data(
n_tp = 200, n_ta = 200,
d_prime = 2.0,
conf_levels = 3,
seed = 42
)
# Ensemble decision rule
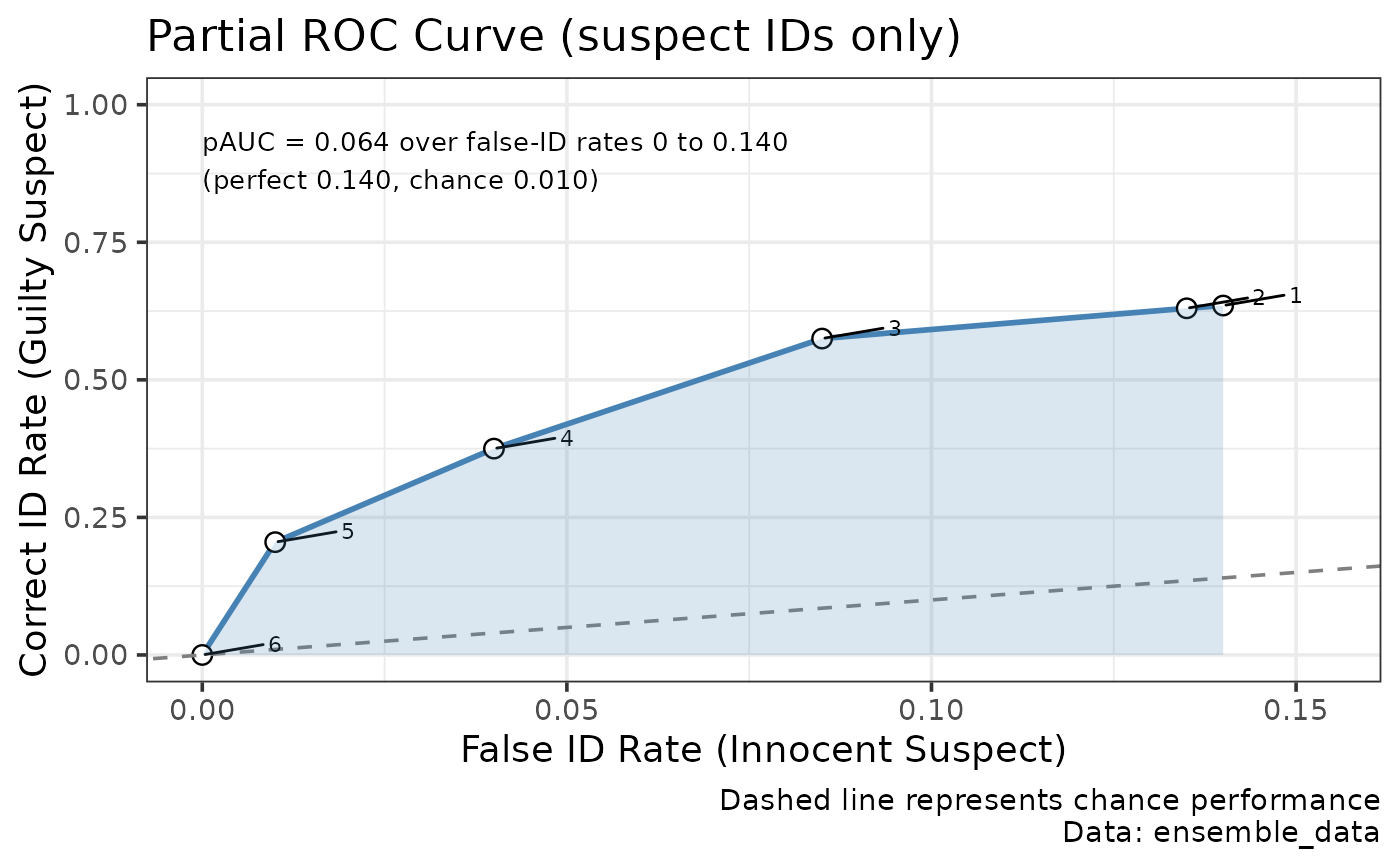
ensemble_data <- simulate_lineup_data(
n_tp = 200, n_ta = 200,
d_prime = 1.5,
decision_rule = "ensemble",
conf_levels = 5,
seed = 42
)
# Integration decision rule
integration_data <- simulate_lineup_data(
n_tp = 200, n_ta = 200,
d_prime = 1.5,
decision_rule = "integration",
conf_levels = 5,
seed = 42
)
# Compare ROC curves across decision rules
roc_max <- make_roc(strong_memory, lineup_size = 6)
 roc_ensemble <- make_roc(ensemble_data, lineup_size = 6)
 # \donttest{
# Power analysis: vary sample size (few simulations, to keep this quick;
# use hundreds in practice)
power_results <- simulate_power_analysis(
sample_sizes = c(50, 100),
d_prime = 1.5,
n_simulations = 5,
n_bootstrap = 50,
seed = 1
)
#> Simulating sample size 50 (5 studies)
#> Simulating sample size 100 (5 studies)
# }