plot() methods for the objects returned by the ROC and CAC functions,
so that plot(x) works directly rather than requiring the user to know
which plot builder matches which object.
Usage
# S3 method for class 'lineup_roc_data'
plot(x, ...)

# S3 method for class 'lineup_roc'
plot(x, ...)

# S3 method for class 'lineup_cac_data'
plot(x, ...)

# S3 method for class 'lineup_cac'
plot(x, ...)

# S3 method for class 'lineup_fullroc_data'
plot(x, ...)

# S3 method for class 'lineup_fullroc'
plot(x, ...)Details
Each ROC/CAC analysis comes in two forms. The *_data() function
computes and returns the data only; the function without the suffix wraps it,
builds the plot, and returns a classed object with the plot stored in
$plot:
These methods accept either form. When a plot has already been built it is
returned as-is; otherwise it is constructed with the matching builder
(make_roc_gg, make_cac_gg or
plot_fullroc).
The value is an ordinary ggplot object, so it can be modified with the usual
+ syntax, e.g. plot(x) + ggplot2::theme_minimal().
Examples
data(lineup_example)
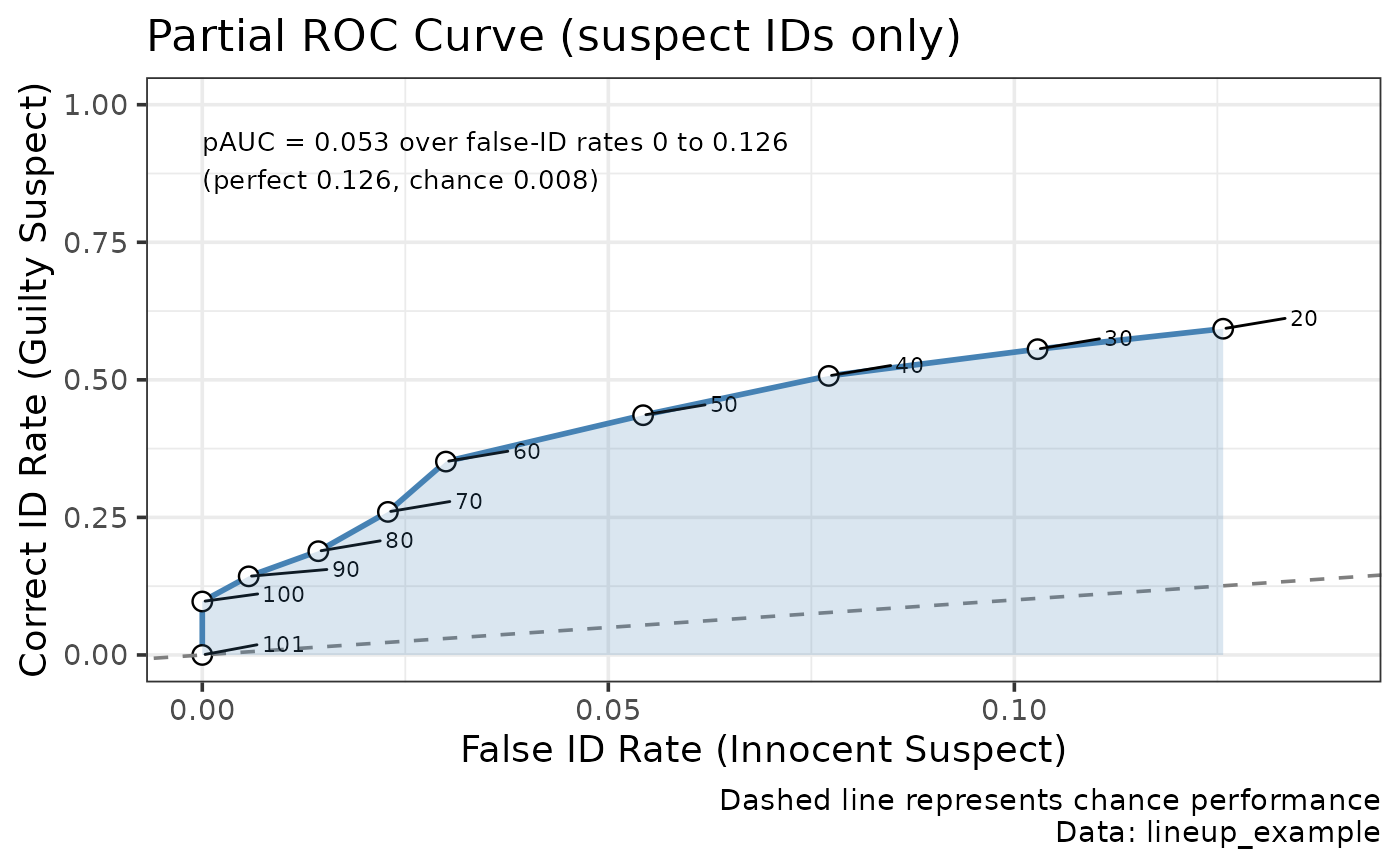
plot(make_rocdata(lineup_example))
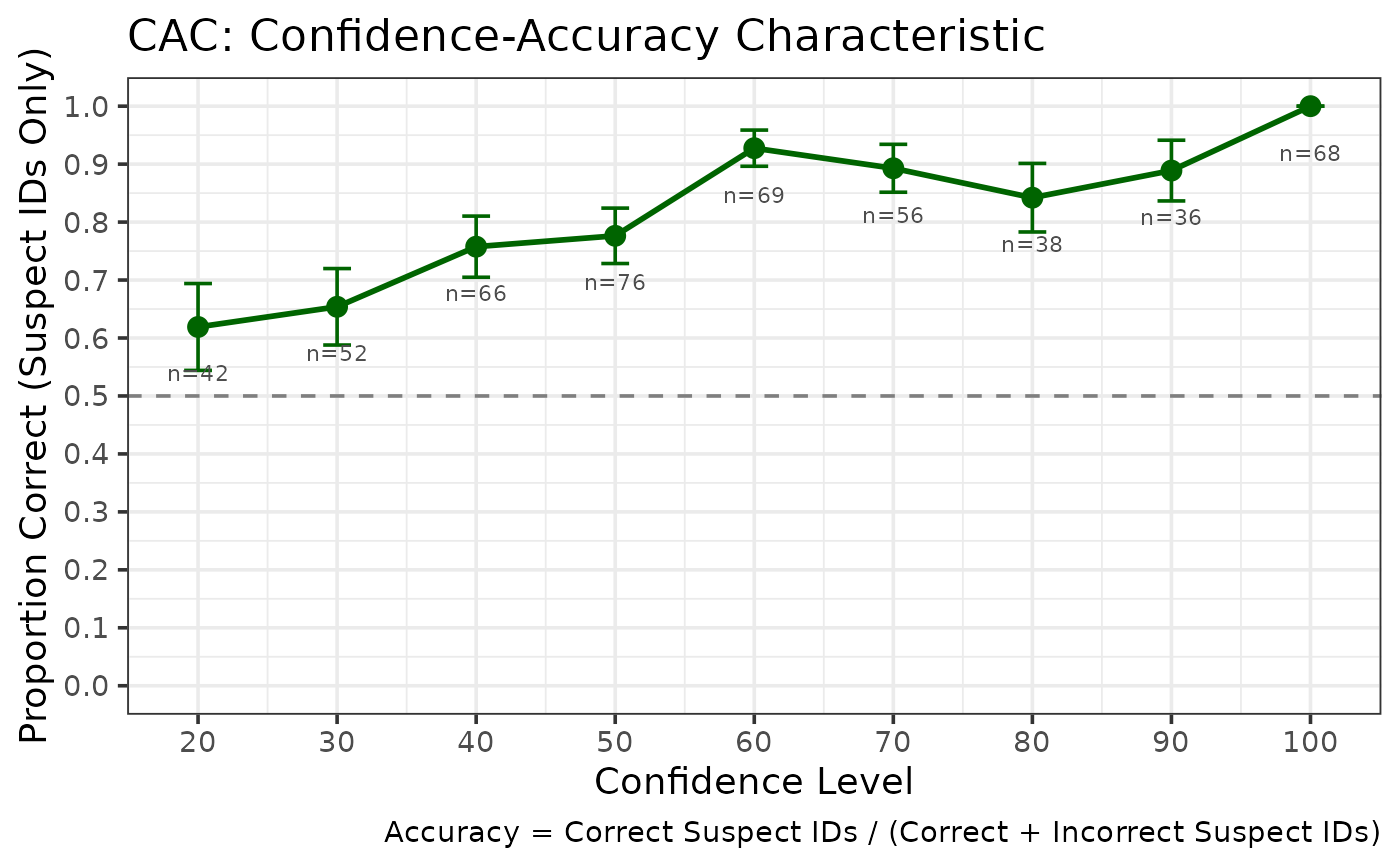
 plot(make_cacdata(lineup_example))